Copper MMI: Prices Edge Up As Global Demand Growth Outpaces Supply Growth
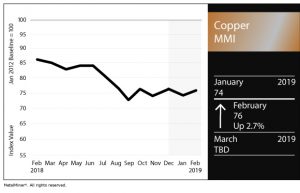
The Copper Monthly Metals Index (MMI) hit 76 this month, up 2.7% after a decrease last month — yet it remains in an oscillating pattern that began in the summer of 2018.
Need buying strategies for steel? Request your two-month free trial of MetalMiner’s Outlook
LME copper prices trended upward this month but were still within the oscillating pattern that started July 2018.
After hitting the late December low of $5,725/mt, the LME price trended upward since early January. LME copper prices increased throughout the first two months of 2019 but are still technically within the resistance boundary of the oscillating pattern, marked by the $6380/mt price point.
From a longer-term perspective, this is beyond the $6,000/mt level that served as the resistance point when prices trended lower during the first seven months of 2017.
A recent report from the International Copper Study Group (ICSG) showed worldwide demand increases are edging out global supply increases of ore and refined production, in terms of aggregate numbers.
The most notable production change reported was an increase in Chilean mine production. The most notable demand increase was the 7% increase in China, most likely due to lower availability of copper scrap in China, as discussed in this month’s MetalMiner February Monthly Outlook.
Vedanta was able to reopen its south Indian copper smelter when the country’s Supreme Court ruled in its favor and overturned a decision by the National Green Tribunal (NGT) to permanently shut down the copper smelter operation due to alleged pollution at its plant in the city of Thoothukudi.
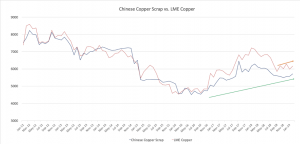
Chinese Scrap Copper
After some divergence in pricing trends, the LME copper and Chinese copper scrap prices re-synchronized in an upward trend. This is due to a short-term LME copper price turnaround, while the China index price is still trending upward gently.
China’s copper premiums fell to an 18-month low recently, indicating there may be some demand weakness.
What This Means for Industrial Buyers
LME copper price momentum appears solid so far during 2019.
Throughout most of 2018, both LME copper and Chinese copper scrap prices trended downward.
Both prices have turned around; however, the uptrend remains somewhat weak.
Historically speaking, prices remain fairly low. With a mild 2.7% increase in the MMI index this month, it’s too soon to determine if copper’s short-term sideways trend is over. Volumes, however, appear fairly buoyant, and prices have trended upward at the start of February.
It’s important for buying organizations to understand how to react to copper price movements. The MetalMiner Monthly Outlook report helps buyers understand the copper marketplace.
Want to a see Cold Rolled price forecast? Get two monthly reports for free!
Actual Copper Prices and Trends
In January, most of the prices in the Copper MMI basket increased, with the exception of Korean copper strip, which fell 0.24%.
Indian copper cash prices increased the most, by 4.24%, to $6.14/kilogram.
The remaining copper prices in the basket increased in the range of 1.8-3.19%, with an average change of 2.59%.


Leave a Reply