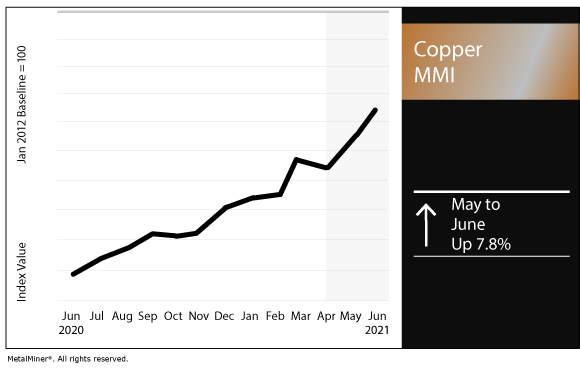
Copper MMI: Copper price cools in second half of May after reaching all-time high
The Copper Monthly Metals Index (MMI) increased by 7.8% for this month’s reading, as the copper price remains high but dipped below the $10,000/mt level.
Each month, MetalMiner hosts a webinar on a specific metals topic. Explore the upcoming webinars and sign up for each on the MetalMiner Events page.
Copper prices retrace
On May 10, the LME three-month copper price closed at $10,720 per metric ton, hitting record highs last month.
Since then, prices declined below $10,000/mt.
SHFE prices followed the same trend.
The price retrace might be due partially to the stern warnings issued by Beijing about market discipline and excessive speculation in an effort to cool off prices.
Moreover, on June 7, trade data from China showed that copper imports fell 8% in May compared to the previous month. This might have scared some investors, as lower imports could mean lower demand, which decreases buying interest.
This could also signal that the pace of economic growth might be slowing. Along with less market speculation, that could mean the price will correct and consolidate.
Copper, oil and the US dollar
Often referred to as “Dr. Copper,” the metal gets its moniker because of its ability to diagnose the overall health of the economy.
Copper has a uniquely widespread application in most sectors. As such, copper demand is a reliable indicator for overall market analysis.
As oil and copper are often affected by similar economic factors, prices fluctuate in a similar fashion. Oppositely, an inflated U.S. dollar tends to increase demand for copper, as it increases accessibility for holders of other currencies.
As seen in the chart, the LME copper prices and the WTI crude price follow the same trend. Both dipped as the pandemic created an economic contraction. However, copper and oil prices increased rapidly as governments announced and implemented economic recovery plans.
However, this price recovery is different. In late 2019, copper prices were around $6,000/mt while oil prices were approximately $57/barrel. At print time, copper prices recovered by 64%, while oil prices 23%. This could be a sign that copper prices are not strictly defined by demand but also by market speculation.
Potential shortage
Another factor that could suggest weakening copper fundamentals is the potential supply disruptions from Chile and Peru.
Codelco announced that 40% of its copper production — equivalent to approximately 12% of global production — could be at risk, as a new bill that restricts mining operations near glaciers continues to advance. The Chilean government proposed a royalty bill to tax copper sales.
Moreover, workers at Escondida, the world’s largest copper mine, and Spencer are threatening to start a strike after failed labor agreements with BHP.
In Peru, early presidential elections results showed Pedro Castillo had the lead. The candidate pledged to take up to 70% of profits from mining operations, which could be detrimental to not only current operations but future investments.
Actual metals prices and trends
The LME three-month copper price increased by 2.3% month over month to $10,171 per metric ton as of June 1.
Meanwhile, Chinese primary cash copper increased by 4.6% to $11,609 per metric ton.
U.S. copper producer grades 110 and 122 rose by 3.6% to $5.51 per pound. Producer grade 102 increased by 3.4% to $5.73 per pound.
Become part of the MetalMiner LinkedIn group and stay connected to trends we’re watching and interesting metal facts.


Leave a Reply