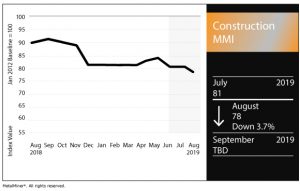
Construction MMI: U.S. Construction Spending Falls 2.1% in June
The Construction Monthly Metals Index (MMI) fell three points for an August reading of 78.
Need buying strategies for steel? Request your two-month free trial of MetalMiner’s Outlook
U.S. Construction Spending
According to the U.S. Census Bureau’s most recent construction spending report, U.S. construction spending reached $1,287.0 billion in June, down 1.3% from the May estimate of $1,303.4 billion.
The June spending estimate also marked a 2.1% decline from the June 2018 estimate of $1,314.8 billion.
Private construction spending totaled $962.9 billion, down 0.4% from May. With private construction, residential construction totaled $507.2 billion, down 0.5% from May. Nonresidential construction reached $455.7 billion, down 0.3% from May.
Meanwhile, public construction spending reached $324.1 billion, down 3.7% from May. Educational construction reached $73.0 billion, down 6.8% from May. Highway construction reached a seasonally adjusted annual rate of $101.9 billion, down 6.4% from May.
Billings Decline in June
Architecture firm billings fell in June after essentially coming in flat the previous two months, according to the American Institute of Architects’ monthly Architecture Billings Index (ABI) report.
The June ABI reflected a contraction in billings with a reading of 49.1, down from 50.9 the previous month (anything greater than 50 indicates billings growth).
Billings have either declined or held flat each month since February, the ABI report showed, the longest such period since 2012.
“In addition, while inquiries into new work and the value of new design contracts remained positive in June, the pace of that growth continued to slow, with inquiries in particular falling to its lowest score in a decade,” the report states. “However, firms are still reporting strong backlogs of work in the pipeline, six and a half months on average, which continues to be the most robust that backlogs have been since we began collecting this data on a quarterly basis in 2010.”
By region, the South (51.9) was the only part of the U.S. in positive growth territory. The Northeast (46.1), Midwest (48.9) and West (49.3) regions all showed billings contraction in June.
This month, the ABI featured a survey of industry professionals on the issue of tariffs, asking them for their level of concern related to tariffs and trade-related retaliation. On a scale from 1-5 (with 1 meaning “not at all concerned” and 5 meaning “very concerned”), 35% of respondents answered either 4 or 5, while 37% checked in at 3 (meaning “somewhat concerned”).
Actual Metal Prices and Trends
Chinese rebar fell 1.0% month over month to $576.54/mt as of Aug. 1. Chinese H-beam steel rose 0.5% to $557.66/mt.
U.S. shredded scrap steel fell 6.2% to $257/st. European commercial 1050 aluminum fell 7.4% to $2,363.71/mt.
MetalMiner’s Annual Outlook provides 2019 buying strategies for carbon steel
Meanwhile, Chinese 62% iron ore PB fines fell 0.3% to $76.24/dmt.


Leave a Reply