Why Manufacturers in the Aluminum Market Feel More Pressure Than Benchmark Prices Suggest

Manufacturers within the aluminum market do not have a simple exchange-price problem. They have a basis problem.
MetalMiner’s latest data shows:
- LME 3-month aluminum at $3,481 per metric ton as of June 10, up 38.7% from a year earlier
- Over the same period, the U.S. Midwest Premium doubled from $0.59/lb to $1.18/lb
For companies that consume physical aluminum rather than simply monitor exchange rates, the number that matters most is the combined LME-plus-premium basis.
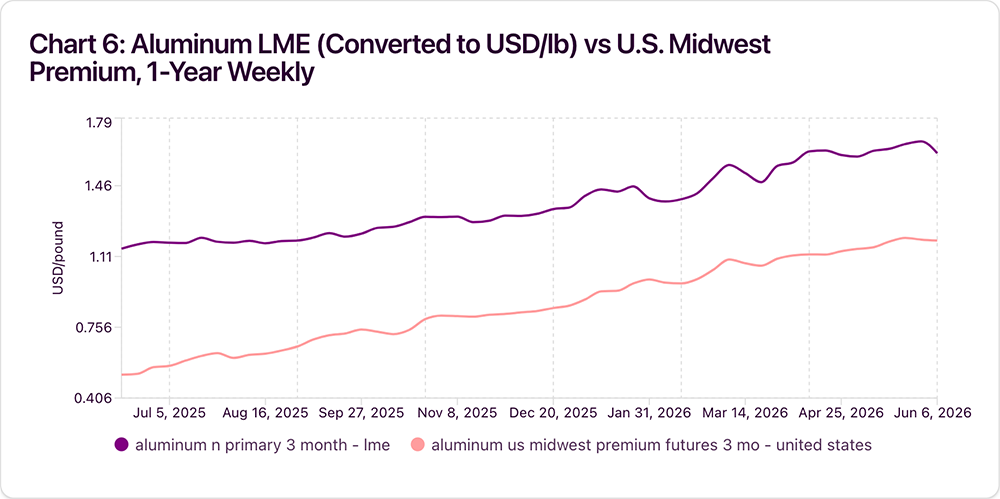
Viewed through that lens, the increase looks much larger.
After converting LME aluminum into pounds and adding the Midwest Premium, the combined basis rose from $1.7285/lb a year ago to $2.7590/lb today. That represents a 59.6% increase before freight, conversion costs, alloy extras, and fabricated-product surcharges.
That distinction changes the management discussion.
Of the $1.0304/lb increase in the combined basis:
- 57.3% came from the Midwest Premium.
- 42.7% came from LME aluminum.
What $10 Million of Aluminum Exposure Looks Like in The Aluminum Market
For every 10 million pounds of annual aluminum consumption, that basis change translates into roughly $10.3 million in additional cost pressure flowing through cost of goods sold.
That is why financial and supply teams need to move beyond viewing aluminum as a single number. The exchange benchmark remains important, but it no longer tells the whole story.
If finance, sourcing, and operations are using different definitions of aluminum exposure, they can reach:
- Different conclusions about budgeting
- More hedging effectiveness
- Optimal sourcing performance
One way executive teams address these challenges is by using tools like Sage to separate exchange-driven moves from premium-driven changes. The goal is not to replace judgment. It is to provide clarity around what actually changed and why.
Elevated Doesn’t Mean Unprecedented
Current LME prices sit approximately 12.3% below that five-year peak and about 73.9% up its five-year range.
That places aluminum in elevated territory, but not at the most extreme levels organizations have had to absorb into budgets and operating plans in recent years.
For finance, supply chain, and sourcing leaders under pressure to explain changing costs, that perspective matters. Elevated prices deserve attention, but context can help distinguish between an uncomfortable market and an unprecedented one.
The Midwest Premium Is the Real Story
Over a five-year period, the Midwest Premium climbed from $0.248/lb to $1.18/lb, a gain of 375.8%.
Its five-year low over that period was $0.1886/lb, while its five-year high reached $1.20/lb.

The current premium sits only 1.7% below that high and approximately 98.0% up its five-year range.
That distinction is the real story for companies trying to manage COGS.
Exchange aluminum remains elevated, but regional premiums are pressing against their ceiling.

For organizations negotiating physical supply while protecting margins, invoice pressure is considerably more severe than the LME chart alone would suggest.
Four Questions Executives Should Be Asking Right Now
- How much of our exposure comes from LME?
- How much of our exposure comes from the Midwest Premium?
- Are those components tracked separately, or together?
The answers often determine whether teams can confidently defend decisions when costs move unexpectedly.
Has the Midwest Premium Stopped Behaving Like a Sidecar?
Treating the Midwest Premium as a small add-on to exchange pricing no longer works.
- At $1.18/lb, the premium is equivalent to roughly $2,601.5/mt
- Put differently, the premium alone now equals about 74.7% of the LME price on a per-metric-ton basis
That is not “background noise”. It is a major part of aluminum’s price architecture.
A year ago:
- The Midwest Premium represented 34.1% of the combined LME-plus-premium basis
- Today, it accounts for 42.8%. The premium’s share of the total aluminum cost stack has widened materially

The Latest Inflation Has Been Premium-Led
The last three months make that shift even clearer:
- LME aluminum rose just 1.1%, increasing from $3,444/mt to $3,481/mt
- The Midwest Premium, meanwhile, climbed 7.8%, from $1.095/lb to $1.18/lb
The latest increment of aluminum cost inflation has been premium-led, not exchange-led.
That distinction has real consequences.
Organizations that manage only the exchange component of exposure can find themselves explaining why risk-management strategies appeared effective on paper while actual invoice costs and margins moved in the opposite direction.
For finance, supply chain, and procurement leaders, this reinforces the need to measure what the organization actually pays rather than relying on proxy benchmarks alone.
What Does the Current Price Structure Mean Without Making a Forecast?
Technical levels are useful not because they predict the future, but because they help organizations understand where current pricing pressure sits within broader cost structures.
MetalMiner’s latest support and resistance data places:
LME Aluminum: Current Levels in Context
- Short-term support for LME aluminum near $3,491/mt
- Short-term resistance for LME aluminum near $3,759/mt
The 12-Month View
- Long-term support sits near $2,470/mt
- Long-term resistance near $3,642/mt
The recent LME price of $3,481/mt is effectively sitting at that short-term support zone while remaining much closer to the top of its one-year range than the bottom.

The Midwest Premium Tells a Similar Story
- Short-term support sits near $1.1268/lb
- Short-term resistance sits near $1.2532/lb
At $1.18/lb, the premium remains between those levels but continues to trade near the upper end of its recent range.
Even without making a directional call, the message is clear.
Elevated regional basis levels feed directly into:
- Supplier quotes
- Contract resets
- Inventory values
- Working-capital requirements
- Gross-margin performance
For organizations trying to stabilize earnings and improve forecast accuracy, these aren’t abstract market indicators. They are inputs that shape day-to-day financial outcomes.
The Cross-Metal Pattern Is Hard to Ignore
Over the last 12 months:
- Copper rose 30.5%
- U.S. HRC increased 26.2%
- U.S. 304 stainless sheet gained 21.4%
- Lithium carbonate delivered into the United States climbed 173.1%

At the same time, HRC and 304 sheet now sit at the top of their one-year ranges. Copper sits at 89.1% of its one-year range, lithium at 87.5%, and LME aluminum at 78.5%.
Aluminum deserves attention on its own merits. But it also forms part of a broader pattern of firm industrial metal pricing that finance, supply chain, and procurement leaders cannot afford to view in isolation.
What Should Executives Change Before Annual Contract Renewals?
The first adjustment is straightforward: budget aluminum on a combined basis, not on LME, the Midwest Premium, or other individual benchmarks alone.
If the market is telling executives anything right now, it is that premium risk has grown large enough to deserve its own leadership attention. Organizations that focus exclusively on exchange exposure risk are understating the costs that ultimately show up on invoices, budgets, and income statements.
Separate the Components of Exposure
The second adjustment is contractual.
Where possible, organizations should separate:
- Exchange exposure
- Regional premium exposure
- Fabrication and conversion exposure

When all three are combined into a single blended line item, organizations lose the ability to explain variance accurately.
That is how CFOs end up seeing “metal inflation” without understanding which part of the metal stack actually moved.
It also weakens the organization’s ability to explain financial outcomes and defend commercial decisions internally.
Can You Map Market Inputs to Actual Spend?
Which index, premium, surcharge, or conversion formula actually maps to what we pay?
Organizations that cannot answer that question often discover risk only after budgets come under pressure.
Those that can answer it tend to navigate volatility with greater confidence.
The Real Takeaway
The clearest reading of the current data is not simply that aluminum is more expensive.
The physical aluminum basis has risen faster than the exchange benchmark, and the Midwest Premium accounts for most of the additional COGS pressure organizations have experienced over the last year.
That distinction is significant enough to alter:
- Budgeting assumptions
- Hedging discussions
- Supplier negotiations
- Working-capital planning
- Executive reporting
Organizations that track only LME aluminum are monitoring an important benchmark. They simply are not monitoring the benchmark most closely tied to what ultimately appears on invoices, budgets, and income statements.
That is also why aluminum belongs in a broader executive review of metal exposure rather than in a siloed commodity discussion.
The Leadership Challenge Has Changed
- Copper remains firm
- HRC sits at the top of its annual range
- U.S. 304 stainless sheet sits at the top of its annual range
- Lithium has rebounded sharply
When several major categories simultaneously trade high within their respective ranges, the leadership challenge changes.
It becomes less about accurately calling the next market move and more about understanding where the business still carries unmeasured exposure that can disrupt forecasts, margins, and working-capital requirements.
That is where the money is.