Top Metal Price Forecasting Tools: What Successful Teams Do Differently

The best metal buying teams are not flashy. They are disciplined. So what are the top metal price forecasting tools?
They are the ones that clearly define exposure and price risk, follow a calculated process, and make decisions before markets force their hand. Over time, that discipline matters more than any single metal buy.
Historical records make the case for disciplined metal buying, and steel, for example, should be described in full-cycle terms. Using the latest available readings, U.S. hot-rolled coil stood at $1,022 per short ton on April 10, 2026, while U.S. HRC CRU spot was $1,046 per short ton on April 8.
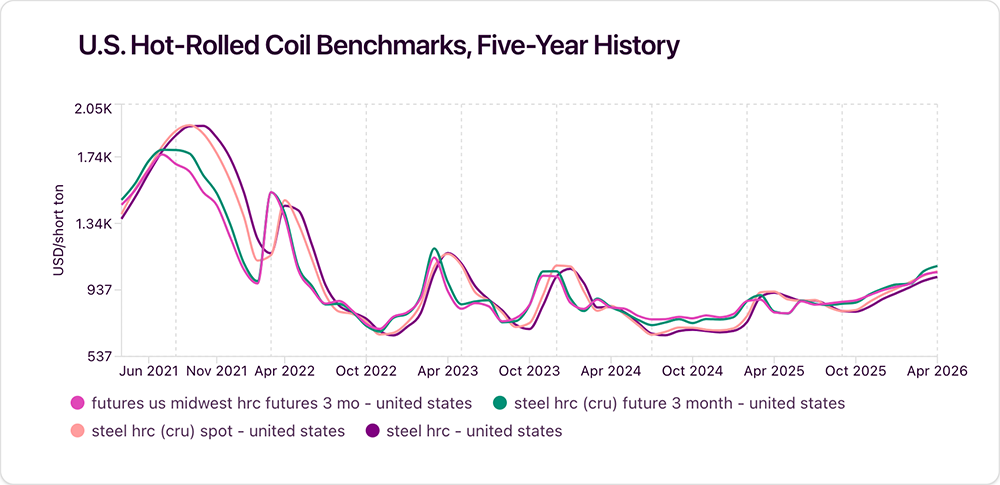
Those levels reflect a substantial recovery from the lows seen in 2025. But on a full five-year basis, the picture is different: the core U.S. HRC benchmark is down about 24.1%, and HRC CRU spot is down about 22.9% from their respective starting points five years earlier. The steel market has recovered materially, but it still remains below the extraordinary highs reached during the 2021 spike.
What Does It Mean to Define Metal Exposure Correctly?
Top teams map the total cost, not just the benchmark.
Steel, once again, is a good example of why that matters. The latest available readings put the core U.S. hot-rolled coil benchmark at $1,022 per short ton and U.S. HRC CRU spot at $1,046 per short ton. Those are clearly stronger levels than the troughs reached during 2025. But a proper five-year view shows that both benchmarks still sit below their 2021 peaks and below where they stood at the start of the five-year window. Over that span, the core U.S. HRC benchmark declined by about 24.1%, while the HRC CRU spot fell by about 22.9%.
Defining metal sourcing price risks effectively means breaking down what actually hits:
- Exchange price
- Regional premium
- Surcharge
- Freight
- Processing
- Contract terms

Aluminum, for example, makes this clear. The bottom graph, pulled from Sage, shows that over five years, LME aluminum rose 52.8%. However, the Midwest Premium surged 450.5%. The correlation between them was only about 0.67. That gap creates real risk.
Why Should Procurement Teams Review the Market on a Fixed Cadence?
Because waiting puts you behind.
Strong teams build a rhythm:
- Weekly reviews for procurement teams
- Monthly reviews for C-suite members and leadership

This ensures visibility before markets move too far. HRC, for example, reached about 71% above its five-year average in July 2021.
How Should Teams Use Forecasts in Metal Buying?
To pressure-test decisions, not prove forecasts.
The best teams use forecasts to ask:
- What happens if prices move outside the plan?
- What if premiums diverge from base metals?
- What if one category breaks away?
Why Do Top Teams Define Triggers Before Markets Move?
Because volatility compresses decision time.
They document:
- When to buy
- When to wait
- When to escalate
- When to hold
As another example, nickel ranged from roughly $14,030 to $48,063 per metric ton over five years. This proves that metal markets are not for improvisation.
How Do Strong Teams Align Procurement with Budgets?
They bring finance in early.
Instead of reacting later, they:
- Translate price exposure into budget ranges
- Model margin sensitivity
- Align on working capital impact
When metal prices move in different directions, budgeting cannot rely on a single assumption. Procurement must lead that conversation.
Should All Metals Be Managed the Same Way?
No. Behavior differs significantly.
MetalMiner data shows:
- Aluminum and copper correlation: ~0.78
- Copper and HRC: ~0.12
- Nickel and HRC: ~0.18

Top teams segment strategies by category. They adjust:
- Contract structure
- Timing cadence
- Internal reporting
Sage helps buyers see these differences clearly, reinforcing why one playbook does not work across all metals.
Why Is Tracking Related Markets Critical?
Because upstream signals drive downstream costs.
Example:
- Nickel and 304 stainless correlation: ~0.78
- Leading relationship (nickel leads): ~0.84

That means stainless buyers need to watch markets like nickel closely.
Should All Metals Be Managed the Same Way?
No. Behavior differs significantly.
MetalMiner data shows:
- Aluminum and copper correlation: ~0.78
- Copper and HRC: ~0.12
- Nickel and HRC: ~0.18
Top teams segment strategies by category. They adjust:
- Contract structure
- Timing cadence
- Internal reporting
Sage helps buyers see these differences clearly, reinforcing why one playbook does not work across all metals.
Why Is Tracking Related Markets Critical?
Because upstream signals drive downstream costs.
Example:
- Nickel and 304 stainless correlation: ~0.78
- Leading relationship (nickel leads): ~0.84
That means stainless buyers need to watch markets like nickel closely.

Why Does Volatility Matter More Than Ending Price?
Because the path drives the real cost trend
Top teams track:
- Trading ranges
- Drawdowns
- Short-term spikes
- Relative movements
How Do Teams Turn Insights Into Repeatable Results?
They document decisions.
They capture:
- What happened
- What they decided
- What would change their view

This builds institutional knowledge and improves consistency over time.
How Should Procurement Performance Be Measured?
Against process, not luck.
Top teams evaluate:
- Did they follow triggers and the correct market signals?
- Did they cover the right price risks and exposure?
- Did they purchase on time?
- Did their purchasing decisions align with their budgets?
Markets do not reward hindsight. Strong decisions matter more than short-term outcomes.
What This Means for Your Sourcing Strategies
The difference is not intelligence. It is discipline.
Top-performing teams:
- Define cost risk correctly
- Maintain a consistent review cadence
- Use forecasts to test decisions
- Align with finance early
- Segment strategies by metal type
- Track upstream drivers
- Measure volatility
- Document decisions
- Evaluate process, not outcomes
Why This Matters in Finding Top Metal Price Forecasting Tools
Metal markets do not move together. Aluminum, copper, nickel, stainless steel, steel, etc., all follow different paths.
That is why process matters. It protects against uncertainty.
And in today’s environment, that protection is the difference between reacting to the market and staying ahead of it.