Raw Steels MMI: Global Steel Prices Fail to Gain Traction
The Raw Steels Monthly Metals Index (MMI) showed mixed price movements in October, with declines outweighing increases for a one-point index drop to 66.
Need buying strategies for steel? Request your two-month free trial of MetalMiner’s Outlook
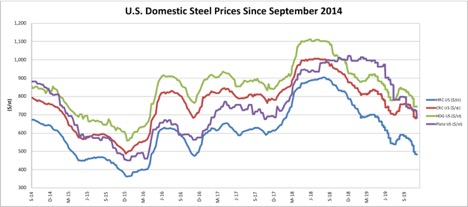
U.S. steel prices continued to weaken during October, possibly reaching a new bottom.
Prices appeared to bottom out back in July (with the exception of plate), especially with price gains seen during August and early September.
Then, weakness set in again throughout September.
Plate prices dropped by another 14% since late August’s high price of $799/st down to $684/st, with prices near those for CRC. While plate prices are closer in line with historical pricing norms, plate prices tend to fall below CRC prices, despite being equal at this time.
HRC prices also looked particularly weak recently, dropping 18% to $483/st from the late August price of $590/st.
While CRC and HDG also dropped below July values to reach new 2019 lows, recent declines were milder (but still significant). CRC and HDG prices dropped 10% and 11%, respectively, over the past couple of months, since reaching higher prices in early September/late August.
U.S. capacity utilization continues to hold above the critical 80% mark, at 80.3%, based on year-to-date production through Nov. 2. Production of 81.6 million tons during that period is up 2.5% year over year, according to statistics from the American Iron and Steel Institute (AISI).
Chinese Prices Fail to Gain Momentum
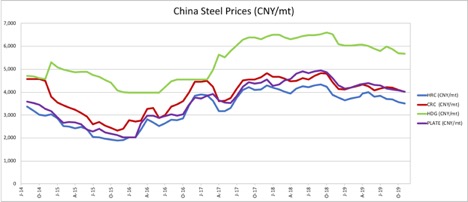
Chinese steel prices looked flat overall but were down slightly of late.
While prices failed to gain any upward momentum, price declines during the past month or two were mild.
Comparing average August prices to early November prices, cumulative declines ranged between 3.3%-5.4% over the period, with HDG and HRC dropping most (at 5.4% and 5.3%, respectively). CRC dropped 4.6% and plate by 3.3%.
U.S.-China CRC Spread Narrows Again, Nears Long-Term Low
With U.S. prices dropping more steeply than Chinese prices during the past few months, the spread between prices on key commodity forms narrowed once more.
Looking at the above chart showing the spread, valued in U.S. dollars per standard ton, we can see the spread dropped to an absolute value of $29/st — its lowest since December 2017’s value of $22/st.
The red line represents average costs associated with imports, indicating at this time U.S. prices should discourage imports by virtue of being relatively affordable.
The purple line represents the theoretical impact of tariff costs (to be adjusted based on actual tariff rates), which render an additional price buffer for domestic producers (in terms of increasing the price that can be charged before imports look more attractive).
In contrast to HRC, the CRC spread continues to exceed levels expected to discourage imports (pre-tariffs), with the spread remaining above $90/st — our theoretical average per standard ton cost associated with importing.
However, prices dropped below the purple line, indicating the tariff creates an import buffer for CRC at a tariff rate of 25% (based on current price differentials).
U.S. Commodity Steel Imports Decline
According to U.S. Census Bureau data, imports of hot roll sheets totaled 151,330 metric tons in September, compared to 157,636 tons in August. September imports of HRC decreased by 15.5%, from 179,105 metric tons in September 2018.
Imports of cold roll sheets totaled 124,286 metric tons in September, compared to 126,704 in August. Compared to September 2018, imports of CRC dropped by around 19.2%, down from 153,728 metric tons the year prior.
On a monthly basis, increased imports came primarily from Mexico, Canada and Turkey. Imports from Korea, Japan and Spain decreased last month.
In terms of year-to-date figures through August, steel imports totaled 18.8 million metric tons compared with 21.7 million metric tons during the first eight months of 2018.
HRC imports decreased the most, while black plate, line pipe and tin-free steel imports increased the most.
On a year-to-date basis through August, imports from Canada declined, while increases occurred from Brazil, Spain and Ukraine.
Chinese Steel Production Increases
Based on data from the World Steel Association (WSA), global production increases slowed in September.
Production from January through September of this year reached 1,391.2 million tons, up by 3.9% compared to the same period of last year. However, last month, the year-to-date increase measured 4.6% for the January-August period.
Year-to-date increases in Asia totaled 6.3% over the period, while E.U. production contracted by 2.8%. North American production of 90.6 million tons translated into a small increase of 0.3%.
September crude steel production declined in most major producer countries compared with September 2018, with the exception of China, India and Italy.
Crude production in China decreased to 82.8 million tons in September, compared with August production levels of 87.251 million tons, but increased by 2.2% compared with September 2018. India’s production increased by 1.6% to 9 million tons in September compared with last year, while Italy produced 2.2 million tons, a 1.1% increase compared with September 2018.
Japan’s September production dropped by 4.5% compared with September 2018, falling to 8 million tons. South Korea saw a drop of 2.7% during the same monthly comparison period, to 5.7 million tons. A decline of 4% hit German production, with 3.4 million tons produced, while France’s production dropped by 10.2% to 1.2 million tons.
What This Means for Industrial Buyers
Global production levels remain higher, primarily driven by high Chinese production, while demand still looks weaker.
If manufacturing gains continue in China, we could see some pricing momentum return. Some signs point in that direction; as of yet, demand has not yet pushed prices higher.
Buying organizations interested in tracking industrial metals prices with ease will want to request a demo of the all-new MetalMiner Insights platform.
Buying organizations seeking more insight into longer-term steel price trends may want to read MetalMiner’s Annual Metal Buying Outlook.
Free Partial Sample Report: 2020 MetalMiner Annual Metals Outlook
Actual Raw Steel Prices and Trends
Steel prices showed mixed movements in October.
Korean scrap prices registered another large drop this month — following last month’s 16.9% decrease — falling another 30.2% to $81/mt. However, Korean pig iron prices increased by 2.8% to $368/mt.
U.S. shredded scrap prices also decreased again this month, falling 11.4% to $225/st.
The U.S. Midwest HRC futures spot price dropped 5.2% to $495/st, while the Midwest HRC futures three-month price increased by 3.6% to $549/st.
LME billet three-month prices dropped 2.3% to $239/st.
Once again this month, Chinese prices in the index showed mixed, generally mild movements.
China billet prices increased by 1.6%, to $496/mt, while HRC prices decreased by 1.2% to $499/mt. Coking coal prices dropped by 5.4% to $248/mt, the largest Chinese price decline this month, while iron ore prices increased by 1.6% to around $63 per dry metric ton.


Leave a Reply