Numerous factors weigh heavily on the base metals and commodity complex: the Chinese copper scrap ban, the Section 232 proclamation on aluminum and steel combined with country-specific exemptions set to expire on May 1, the Section 301 investigation, and multiple strikes at copper and nickel mines to boot. After the turmoil of the first few […]
Aluminum Recovers With More Than 13% Price Jump in a Week
At the end of week before last, aluminum prices seemed to struggle; some thought the metal might have shifted to bearish country. However, after that LME aluminum prices jumped by more than 13% in a week. LME aluminum prices retraced to August resistance levels ($1,972/mt), and then increased sharply again. Need buying strategies for steel? […]
Stainless Steel MMI: LME Nickel Prices Fall But Stainless Steel Surcharges Rise
The Stainless Steel MMI (Monthly Metals Index) inched one point higher in April. The current reading is 76 points.
Need buying strategies for steel? Try two free months of MetalMiner’s Outlook
The index’s increase was driven by the rise in stainless steel surcharges, despite slightly falling LME nickel prices this month. Other related metals in the stainless steel basket increased.
LME Nickel
In April, nickel price momentum appears to have recovered from its previous pace.
LME nickel prices dropped in March, along with other base metals. However, the drop appears less sharp than for aluminum or copper.
[caption id="attachment_91260" align="aligncenter" width="580"]
LME nickel prices remain high and far away from 2017 lows back in May or June, when MetalMiner recommended buying organizations buy some volume forward. Prices back at that time were around $8,800/mt versus the current $13,200/mt price level.
Domestic Stainless Steel Market
Following the recovery in stainless steel momentum, domestic stainless steel surcharges increased this month.
The 316/316L-coil NAS surcharge reached $0.96/pound. Therefore, buying organizations may want to look at surcharges to identify opportunities to reduce price risk either via forward buys or hedging.
[caption id="attachment_91261" align="aligncenter" width="580"]
The pace of stainless steel surcharge increases appears to have slowed this month. However, surcharges have increased from 2017. The 316/316L-coil NAS surcharge is closer to $0.96/pound.
What This Means for Industrial Buyers
Stainless steel momentum appears stronger this month, with steel prices skyrocketing.
As both steel and nickel remain in a bull market, buying organizations may want to follow the market closely for opportunities to buy on the dips.
To understand how to adapt buying strategies to your specific needs on a monthly basis, take a free trial of our Monthly Outlook now.
MetalMiner’s Annual Outlook provides 2018 buying strategies for carbon steel
Actual Stainless Steel Prices and Trends
Raw Steels MMI: Domestic Steel Price Momentum Picks Up
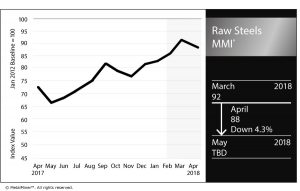
The Raw Steels MMI (Monthly Metals Index) fell four points this month, dropping to 88. Despite the drop in the Raw Steels MMI, domestic steel price momentum has been on a tear throughout March. All prices for the main forms of flat-rolled steel products have reached more than seven-year highs.
Domestic steel prices accelerated their pace of increases in such a way that HRC domestic prices have risen from the $600-$650/st level to around $850 in the last three months.
[caption id="attachment_91239" align="aligncenter" width="580"]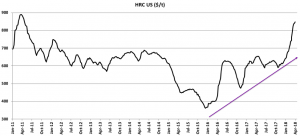
The steel price increase comes as a result of several factors. First, the long-term trend that started in 2016 created upward movement for steel prices. Second, the delayed steel sector cyclicality (seasonality) has pushed the steel price slope even steeper.
Historically, prices usually increase during Q4 as many companies renegotiate their annual agreements as part of the budgeting season for the following year. However, this year, steel price increases didn’t occur until later. Prices appeared to wait for the Section 232 outcome (with its corresponding tariffs), which acted as a support for domestic steel prices.
However, domestic steel prices seem closer to the end of this latest price rally. Based on historical steel price cyclicality, lower Chinese steel prices and decreasing raw material prices, domestic steel prices may fall in the coming months.
The Divergence in Steel Prices
Chinese steel prices and U.S. steel prices usually trade together. However, the short-term trend sometimes shows some divergences.
Short-term trends may be created by local uncertainty or sudden disruptions with local supply. But these short-term trends tend to correct, and return to their historical pattern.
[caption id="attachment_91240" align="aligncenter" width="580"]
When looking at Chinese and U.S. HRC prices in tandem, the price divergence observed this month leaves no one surprised.
U.S. HRC prices skyrocketed, while Chinese HRC prices continue to fall. It is true that Chinese HRC prices increased sooner in 2017 (starting June 2017), supported by the steel industry cuts in China. The spread between Chinese and domestic steel prices dropped in Q3 2017, as U.S. domestic steel prices traded sideways. The recent drop in Chinese steel prices may create downward price pressure for domestic steel prices.
Global Steel Market
Chinese steel production cuts continue. The city of Handan ordered steel mills to cut around 25% of their steel production to continue the pollution curb measures. These cuts will be extended from April to mid-November. The coking coal industry will also cut production by around 25% over that period. The cuts started on April 1.
According to the Mexican government’s official gazette, the Mexico economy ministry has formally imposed anti-dumping duties on carbon steel pipe imports from South Korea, Spain, India and Ukraine.
Raw Materials
After the prior raw material price increases at the end of 2017, raw material dynamics seem to have slowed down.
Iron ore prices fell sharply in March. Iron ore prices increased slightly at the beginning of this month. However, the sharp decrease in prices last month may not support the current highs in domestic steel prices.
[caption id="attachment_91243" align="aligncenter" width="580"]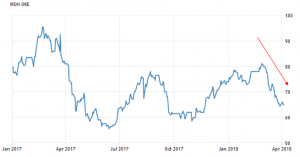
Coal prices also fell in March. Coal prices seem to be increasing slightly again this month, even if current prices remain far away from the $110/mt highs in January 2018.
[caption id="attachment_91244" align="aligncenter" width="580"]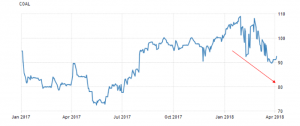
What This Means for Industrial Buyers
As steel price dynamics showed a strong upward momentum this month, buying organizations may want to understand price movements to decide when to commit to mid- and long-term purchases. Buying organizations looking for more clarity on when to buy and how much to buy of their steel products may want to take a free trial now to our Monthly Metal Buying Outlook.
Actual Raw Steel Prices and Trends
Aluminum MMI: LME Aluminum Continues Downtrend
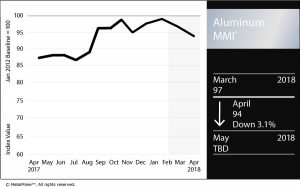
The April Aluminum MMI (Monthly Metals Index) fell three points. A weaker LME aluminum price led to the price retracement. The current Aluminum MMI index stands at 94 points, 3% lower than in March.
LME aluminum price momentum slowed again this month. LME aluminum prices remain in a current two-month downtrend.
Buying Aluminum in 2018? Download MetalMiner’s free annual price outlook
[caption id="attachment_91252" align="aligncenter" width="580"]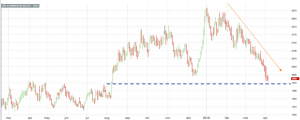
Though some may want to declare a bearish market for aluminum, prices are still over the $1,975 level, when MetalMiner recommended buying organizations buy forward. Prices may retrace back toward that level. However, if prices fall below the blue-dotted line, aluminum prices could shift toward bearish territory.
SHFE Aluminum
SHFE aluminum spot prices also fell this month. The degree of the decline appears less sharp than for LME prices. However, SHFE aluminum spot prices started to fall in October 2017.
[caption id="attachment_91253" align="aligncenter" width="580"]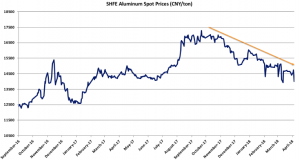
Shanghai Futures Exchange (SHFE) aluminum stocks fell in March for the first time in more than nine months. Decreasing stocks sometimes point to falling inventories of aluminum in China, the world’s biggest aluminum producer and consumer. SHFE stocks dropped by 154 tons in March, according to exchange data released at the beginning of April. However, SHFE aluminum stocks still stand at 970,233 tons.
MW Aluminum Premiums
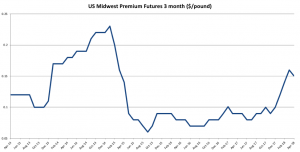
Meanwhile, U.S. Midwest aluminum premiums fell for the first time since November 2017. The $0.01/pound drop at the beginning of April comes after a sharp uptrend in the premium. Despite the lower premium this month, the pace of the increases may continue for some time.
What This Means for Industrial Buyers
LME aluminum price retracement may give buying organizations a good opportunity to buy, as prices may increase again.
However, as prices are currently trading lower, buying organizations may want to wait until the market shows a clearer direction. Therefore, adapting the “right” buying strategy becomes crucial to reducing risks.
Given the ongoing uncertainty around aluminum and aluminum products, buying organizations may want to take a free trial now to our Monthly Metal Buying Outlook.
Want to see an Aluminum Price forecast? Take a free trial!
Actual Aluminum Prices and Trends
Copper MMI: LME Copper Prices Fall
The Copper MMI (Monthly Metals Index) traded lower again this month, falling two points to 85. The Copper MMI dropped to December 2017 levels, driven by falling LME copper prices.
Need buying strategies for steel? Try two free months of MetalMiner’s Outlook
When looking at the long-term trend, copper prices have held above the dotted blue line since September 2016. Although prices dipped a bit below the blue dotted line at the end of March, the line represents the current copper floor. Prices falling below the dotted line could suggest a short-term price correction.
[caption id="attachment_91215" align="aligncenter" width="580"]
Meanwhile, trading volume appears to be about the same as last month, when selling volume appeared weak. As the selling volume remains weak, the downtrend seems more like a short-term price correction than a change of trend.
Buying organizations may want to closely follow copper prices in the coming month or read our Monthly Metal Outlook in order to anticipate copper price movements.
Copper Stocks and Supply
LME copper stocks currently stand at 324,900 tons, up by 13,075 tons since the start of 2017 and 85,500 tons since the start of 2016.
According to the International Copper Study Group (ICSG), the provisional 2017 refined copper deficit was 163,000 tons. The situation for 2018 will also depend on the supply side, as many of the largest copper mines have upcoming labor contract negotiations still pending.
On top of that, the Caserones copper mine in Chile announced a shutdown this month in order to replace a leaking pipe. However, this shutdown is only partial and may not have a big effect on copper production.
Copper Scrap
Both Chinese copper scrap prices and LME copper prices typically trade together. In March, Chinese copper scrap prices fell to $6,035/mt. LME prices also fell but remain in a long-term uptrend. The same is true for copper scrap.
[caption id="attachment_91216" align="aligncenter" width="580"]
The spread between Chinese scrap copper prices and LME copper seems to be wider than it was back in 2016 and 2017. A wider spread may boost scrap copper demand for the applications that it are suitable due to its lower price.
What This Means for Industrial Buyers
Copper prices are currently approaching December support (at $6,530/mt) levels, when prices last dipped during the bullish rally.
Buying organizations bought some volume then. As long as copper prices remain bullish, buying organizations may want to buy on the dips. For those who want to understand how to reduce risks, take a free trial now to the MetalMiner Monthly Outlook.
MetalMiner’s Annual Outlook provides 2018 buying strategies for carbon steel
Actual Copper Prices and Trends
A Look Back at a Turbulent March in the World of Commodities
Section 232 aside, given the market turbulence this month MetalMiner took a look back at commodities and other base metals to reassess trends. Need buying strategies for steel? Try two free months of MetalMiner’s Outlook Commodities have traded lower in March, slowing down from their previous pace. Crude oil prices (one of the most important […]
Have Zinc Prices Already Peaked?
This month, zinc prices started to trade lower, returning to the $3,200 level. This activity represents the first short-term price pullback we’ve seen in zinc prices since June 2017, when prices started their latest rally. Need buying strategies for steel? Try two free months of MetalMiner’s Outlook But going back even further, the zinc price […]
Stainless MMI: LME Nickel Prices Drop While Stainless Surcharges Rise
The Stainless Steel MMI (Monthly Metals Index) traded flat in March after a big jump in February. The current reading is 75 points.
Need buying strategies for steel? Try two free months of MetalMiner’s Outlook
The index remained flat as LME nickel prices decreased slightly, while other elements of the stainless steel basket increased. Stainless steel surcharges jumped again this month, largely following the previous month’s LME nickel price movements.
LME Nickel
Nickel momentum appears to have slowed since the beginning of March. Prices retraced slightly. However, nickel prices remain in a strong, long-term uptrend.
[caption id="attachment_90804" align="aligncenter" width="580"]
Like copper prices, nickel prices remain above the blue dotted line above. In December, nickel prices rallied and started to trade with a sharper slope, following the purple dotted line.
However, these movements are often not sustainable in the long-term trend, and commonly correct. Therefore, nickel prices retraced to their long-term trendline, while trading volume remains supportive of the uptrend.
Domestic Stainless Steel Market
Following the recovery in stainless steel momentum, domestic stainless steel surcharges increased further this month.
The 316/316L-coil NAS surcharge breached its previous $0.8/pound ceiling. Stainless steel surcharges increased again rapidly. Therefore, buying organizations will want to look at surcharges to identify opportunities to reduce price risk either via forward buys or hedging.
[caption id="attachment_90805" align="aligncenter" width="580"]
Tariffs Do Not End in the U.S.
The European Commision prolonged the already existing anti-dumping measures on Chinese imports of stainless steel seamless pipes and tubes for another five years. The duties imposed initially in 2011 ranged from 48.3% to 71.9%. These duties gave European stainless steel producers — like France, Spain and Sweden — some breathing room.
The review of these measures started again in December 2016 and showed the removal of duties on Chinese products would harm European producers.
Therefore, the European Commission agreed to maintain the current duties on pipes and tubes used in the chemical and petrochemical industries for another five years.
Although the Europeans have not enacted broad tariffs like the U.S. has done via Section 232 of the Trade Expansion Act of 1962, the issue of global overcapacity remains paramount as the E.U. continues to implement heavy duties on stainless steel products to limit imports.
What This Means for Industrial Buyers
Stainless steel momentum appears stronger this month, recovering from its previous weakness.
As both steel and nickel remain in a bull market, buying organizations may want to follow the market closely for opportunities to buy on the dips.
To understand how to adapt buying strategies to your specific needs on a monthly basis, take a free trial of our Monthly Outlook now.
Buying organizations who have concerns about the Section 232 impact on the steel industry may want to read our comprehensive Section 232 Report, which includes new data.
MetalMiner’s Annual Outlook provides 2018 buying strategies for carbon steel
Actual Stainless Steel Prices and Trends
Raw Steels MMI: Steel Prices Gain Momentum in February
The Raw Steels MMI (Monthly Metals Index) increased 7% this month, reaching 92 points. This reading is the highest since June 2012. The skyrocketing MMI came as a result of sharp increases in steel prices, the Section 232 release and President Trump’s comments regarding imposition of a 25% steel tariff.
Need buying strategies for steel? Try two free months of MetalMiner’s Outlook
Steel price momentum strengthened in February, moving sharply up for all forms of steel. Steel prices have reached more than three-year highs. However, some forms of steel are now even higher. Domestic HRC prices, currently at $762/st, haven’t seen these levels since June 2011.
[caption id="attachment_90758" align="aligncenter" width="580"]
Based on the long-term analysis, steel prices will likely continue to rise this year. Even if the seasonality for steel prices returns in Q2, steel price momentum appears strong.
Let’s Talk Spreads
Section 232 — and the price uncertainty it has unleashed — requires metal-buying organizations to pay more attention to what is called the spread. The spread refers to the price delta between domestic HRC and CRC prices and the spread of each with Chinese prices. Analyzing and understanding these spreads helps to determine by how much mills could increase steel prices (as well as how high they can go).
So, let’s take a look at some examples.
The Domestic HRC-CRC Spread
As with all the other forms of steel, CRC prices also increased again this month. The upward movement remains strong, even if the amount of the increases — and therefore the slope of the upward trend — appears softer (less sharp).
This does not come as a surprise, as the spread between CRC and HRC prices was extremely high. Now, the spread between CRC and HRC prices has returned closer to historical levels.
[caption id="attachment_90759" align="aligncenter" width="580"]
It is important to understand where the spread comes from. CRC (cold rolled coil) is HRC (hot rolled coil) plus one additional rolling process. As per the chart above, from 2011 to 2016 the price spread between the two has been around $100/st (plus or minus).
At the end of 2016, buying organizations could see a $201/st spread between HRC and CRC prices. The spread started to decline at the beginning of 2017, and has increased further in 2018. The domestic spread is currently at $124/st, much closer to its historical levels. (MetalMiner covered domestic spreads in our free Annual Outlook Report published in October 2017.)
A higher spread creates better margins for domestic mills. From a buying perspective, the previous anomaly only helps a buying organization that has not contracted for all of its CRC purchases (and can play a price arbitrage game by purchasing HRC and paying to roll it to CRC).
Chinese Spread
Chinese demand has always been positioned as one of the main drivers of global steel prices. Check out the correlation in the graph below between the domestic HRC and Chinese HRC prices. When Chinese prices increase, U.S. domestic prices tend to increase, too. The same is usually true when prices fall.
[caption id="attachment_90760" align="aligncenter" width="580"]
Even if short-term events (such as the release of the Section 232 report or President Trump’s comments) add support to steel prices in one country, the general trends tend to correlate.
This is exactly what happened with U.S. HRC prices.
The latest increase in HRC prices here in the U.S. came as a result of the Section 232 uncertainty and the announcement of the tariff. Not surprisingly, so far this month, HRC prices in China increased after trading sideways last month. Therefore, watching price reactions in China makes sense in order to better forecast price trends in the U.S.
An analysis of the spread between Chinese and U.S. prices allows buying organizations to better understand the price impacts the tariffs could have on domestic steel prices. In other words, the spread tells us how much domestic prices could rise before it is better to import steel from China.
What This Means for Industrial Buyers
The strong upward momentum for steel, together with the Section 232 outcome and President Trump’s comments regarding steel tariffs, drove steel prices to more than three-year highs. Buying organizations who have concerns about the Section 232 impact on the steel industry may want to read our Section 232 Report.
MetalMiner’s Annual Outlook provides 2018 buying strategies for carbon steel
Actual Raw Steel Prices and Trends


