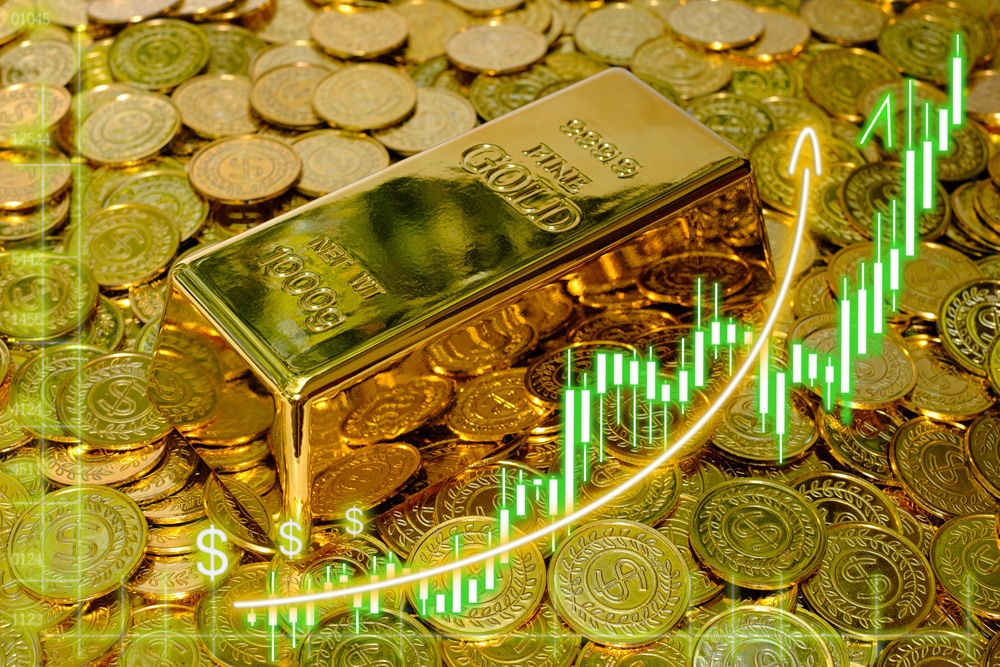
Gold Prices Hover Near Psychological Range of U.S. $2,000

For decades, gold has remained the best-performing asset class, providing double-digit returns for investors. True to form, gold demand this quarter remains above the long-term average as precious metal prices continue to move in response to global events. According to the World Gold Council (WGC), gold buying by central banks also continues at a scorching pace. And while jewelry demand declined a wee bit due to high prices, it was a mixed bag on the investment front.
According to Council data, demand for the yellow metal was up 8% in Q3, just ahead of its 5-year average. That said, it was still down 6% year-over-year. Meanwhile, at 337 tons, central bank buying rates were the third-strongest ever, though still not as high as the 459 tons seen during the same period last fiscal. To date, buying by central banks was up 14% compared to 2022. Total demand, too, was up 6%, year-over-year. Nonetheless, gold ETFs lost 139 Tons in Q3, which was comparatively smaller than the same period last year. Finally, gold mining produced a record 971 Tons in Q3, boosting global supply to 1,267 Tons. This represents an increase of 6% year-over-year.
Subscribe to MetalMiner’s free weekly newsletter now for valuable inside information on precious metal prices, news, and much more.
Gold Surges Past Other Precious Metal Prices
Many countries, including India, saw higher local gold prices, mostly due to currency weakness against the U.S. dollar. On Tuesday, spot gold was down 0.2% to U.S. $1,992.79 per ounce in early trade. Meanwhile, U.S. gold futures were down 0.2% to U.S. $2,002.10. That said, these prices are still quite high when compared to spot prices on Oct 6, which averaged $1,809.50. According to a report in cnbctv18.com, bullion prices remain on track for an 8% rise in October, the highest increase since last November.
Historically, many investors see gold as a crisis commodity. For this reason, prices tend to surge upward whenever there is geopolitical conflict or any form of economic downturn. During such times, physical gold and gold-backed securities tend to outperform. Of course, inflation is another major driver.

For now, global prices continue to hover in the “psychological range” of U.S. $2,000. This term refers to the range at which human psychology and behavior tend to influence trading more than other factors. Still, some analysts say the chances of gold going past the nominal historic high reached in August 2020 remain elevated as investors await the outcome of the U.S. Federal Reserve’s policy outlook.
For the uninitiated, a wide range of factors often affect gold bullion costs as well as other precious metal prices. These range from geopolitical problems and macroeconomic factors to currency movement and the overall cost of mining and refining.
Subscribe to MetalMiner’s free Monthly Metals Index report and use it to anticipate market changes and make strategic precious metal investment and purchasing decisions.

What’s Up in India & China?
Generally speaking, gold prices remain on the upswing in the Indian market. However, the very high price could prove to be a buying barrier during the country’s ongoing festive season. A recent Reuters report quoted the WGC as saying this development could result in the lowest buying volume of the last three years. That said, the report indicates that a drop in purchases would mean a rally in global bullion prices. Historically, India sees the highest sales of gold in the December quarter, coinciding with festivals like Diwali. The same goes for the wedding season, when buying gold is believed to be auspicious.

In India, local gold prices were up by about 20% compared to last year. But by WGC’s own reckoning, demand in this quarter may be low when compared to the 274 metric tons seen during the same period of 2022. Furthermore, analysts say the price could be the major differentiator. If it drops in the next few days, gold uptake may see a boost. For instance, during the July-September quarter this year, consumption was up 10% in jewelry and investments. But in the quarter prior to that, demand fell by 3.3% to 482 metric tons.
The Reuters report indicates that demand could eventually fall to about 700 metric tons in 2023, a three-year low. For reference, last year, it was 774.1 MT. Recent reports indicate that Chinese dealers offered the U.S. $5 per ounce discount on domestic prices. Still, the country’s net gold imports declined about 11% this September, lower than the previous month. Overall, the WGC forecasts that the uptick in bar and coin demand in India and China would continue this quarter, but due to different reasons.
Stop obsessing over actual forecasted precious metal prices. It’s more important to spot the trend. Read why.


Leave a Reply