Copper MMI: Sanctions Hit Copper Market, Volatility Ahead

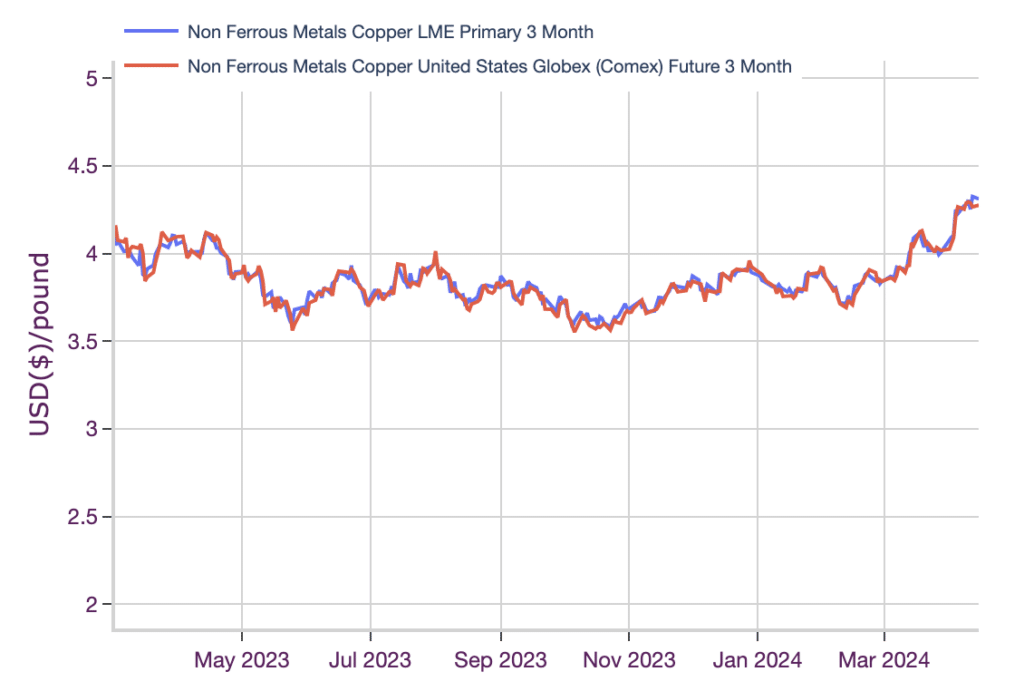
Copper prices continued their breakout during March, rising 4.25%. Prices then formed a second higher high on March 15, followed by a new higher low on March 27. The rally continued throughout April as prices climbed an additional 7.59%. As of April 15, they stand at their highest level since June 2022.
Subscribe to MetalMiner’s free weekly newsletter now and get the most ROI within metal markets experiencing rallies and price surges.

New Russian Sanctions Hit Copper, Aluminum, Nickel
The UK and U.S. announced a new round of sanctions late Friday afternoon, restricting the trade of Russian copper, aluminum, and nickel on global metal exchanges. The new rules will prohibit the LME and CME from accepting deliveries of Russian metal produced on or after April 13. The U.S. also banned the import of all three metals from Russia, following the previously leveled 200% tariff on Russian aluminum.
The news hit markets slightly before the CME’s closing on April 12, causing prices to spike in the final hours. Prices rose over 1.4% alongside a surge in trading volumes between 4:30 PM and 5:00 PM, as markets began to factor in how the new rules would impact them.
Both CME and LME copper prices remain within roughly two-month rallies. These saw prices find a bottom in early February before repeatedly breaking above previous highs over the ensuing months. The latest round of sanctions came with upside risk as markets priced in the overall impact. However, prices showed only a slight day-over-day fluctuation by Monday, which saw CME prices rise a mere 0.22% while LME prices slid 0.30%.
The aluminum market saw the most significant increase from Friday’s close, as prices rose 2.08% day over day. Meanwhile, the LME’s aluminum contract came with the greatest risks due to the proportion of Russian metal sitting in LME warehouses. In March, Russian-origin metal accounted for 62%, 91%, and 36% of LME copper, aluminum, and nickel stocks, respectively.
MetalMiner Insights covers copper price points, correlation charts, and copper price forecasting for a full suite of copper forms and gauges. See our full metals catalog.
Will Exchange Pricing Diverge?
As markets deplete the reserves of Russian-origin metal within inventories, it could leave an upside risk to prices, specifically for the LME. The many sanctions announced prior to the most recent ban left a steep discount on Russian metal prices, especially aluminum. This could lead to pricing distortion between the exchanges, although the delta between the two price points currently remains within range of its historical average.
That said, the following weeks could threaten the longstanding 99.82% correlation between CME and LME copper prices. Indeed, a wider-than-average delta emerged between LME and CME aluminum prices on Monday. However, this would need to be far more sustained to suggest a meaningful divergence in price trends.
Aside from pricing, the ban could see a shift in open interest between the exchanges. Risks for the LME contract could also lead to an exodus toward the CME, which is already widely used in the U.S. as a contracting benchmark for copper prices.
As with sanctions past, the new ban will not necessarily cut off the supply of Russian metals from global markets. The rising number of buyers who stopped purchasing Russian metal since the war in Ukraine really only served to push the material to other destinations. China became “the buyer of last resort,” with a steep pickup in imports from Russia compared to historical trade flows.
These new bans will likely trigger further rerouting. SHFE inventories could see a boost as they continue to admit Russian metal no longer accepted by Western exchanges. As a result, the rising volume of discounted Russian metal could impact SHFE prices.
MetalMiner’s MMI report includes 10 metal price reports (including copper) which you can use as an economic indicator for contracting, price forecasting and predictive copper analytics. Sign up here.
Differing Contangos Between LME, CME Copper Prices
As with all shocks, the market will require time to price in and adjust to the latest shift. This could translate into increased price volatility across exchanges as markets learn the full ramifications of how the sanctions will impact global price discovery and trade flows. The potential divergence of exchange prices remains the largest risk to markets and buyers, although it has yet to become meaningfully apparent.
But while future prices continued to correlate with a negligible delta, primary cash prices began to see a greater divergence between the LME and CME. Though both exchanges show contango, with future prices trending above spot, the spread appeared significantly wider on the LME.
Prior to the recently issued sanctions, the copper price rally came with growing risks to its longevity. Supply fears triggered by smelter cuts in China prompted an increase in bullish bets, particularly among investment funds whose large positions hold outsized impact over price direction. This offered strong momentum, which helped prices break out after they found a bottom in mid-February.
However, the market speculation regarding supply fears lacked underpinning from observable tightness within the market on the LME. Therefore, primary cash prices continued to sag beneath their three-month counterparts, expanding the delta between the two to a staggering $116/mt by April 15. This far outpaces the $11/mt average seen since 2012.
By comparison, the same spread on the CME totaled only $40/mt. The differing contangos were not caused or triggered by the latest sanctions, but they do suggest the existence of differences between the two exchanges. This could prove increasingly important should the sanctions cause the CME to gain greater influence over the market.
Biggest Copper Price Moves
Read what’s next for copper prices in this month’s Monthly Metals Outlook. The report provides both short-term and long-term forecasts as well as buying strategies, giving you the edge to navigate market volatility. Secure a free sample report.
- Chinese copper wire prices appeared bullish, with a 5.23% rise to $10,072 per metric ton as of April 1.
- Indian primary cash copper prices saw a 4.6% increase to $9.11 per kilogram.
- Japanese primary cash copper prices rose 4.43% to $8,975 per metric ton.
- LME primary three month copper prices increased by 4.25% to $8,835 per metric.
- U.S. copper producer prices for grades 110 and 122 saw a 3.47% rise to $5.07 per pound.


