What does the future hold for U.S. road haulage after COVID-19?
An intriguing article by McKinsey headlines by asking what the future holds for the U.S. road haulage industry post-COVID-19 but in so doing goes on to illustrate an industry in long-term decline.
The collapse in industrial activity has hit the freight transportation and logistics industry hard these last few months, but freight’s problems have been on a slow burn for much longer.
McKinsey identifies four dynamics driving change for the industry, dynamics the article explores in the context of recoveries after previous recessions.
Looking for metal price forecasting and data analysis in one easy-to-use platform? Inquire about MetalMiner Insights today!
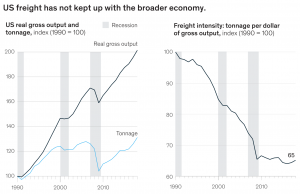
The secular decline can be traced back to around 1990 and is expressed as a drop in freight intensity, or the ratio of freight to the value of all goods and services produced by the nation’s economy.
Intuitively, you would expect freight volumes to be something of a bellwether for economic activity. Indeed, economists have recently used traffic volumes as one measure of a return to economic activity following the easing of lockdowns.
But McKinsey’s research suggests there is no natural law between freight and economic activity and that, as services have taken over from manufacturing as a percentage of wealth generation, freight has largely declined (with one exception, which we will come to shortly).
Research suggests there are four structural factors determining the path of freight growth in the U.S. economy after previous crises: a secular shift from freight-heavy to freight-light economic activity; the globalization of North American supply chains; the rise of e-commerce; and the growth of energy production in North America.
After every recession, freight traffic has taken a hit, but the recovery has been hampered by a combination of changes in these four competing dynamics.
Changing consumer habits
The move to freight-light activity reflects the change in consumption habits with the rise of services over manufacturing. For example, Millennials and Generation Zers have a greater preference for services than previous generations. They spend 47% of their food budgets eating out, compared with 29% of Baby Boomers.
The rise of e-commerce has boosted activity for light freight, the last mile van delivery, and the proliferation of smaller modern warehouses to hold local inventory.
E-commerce has been a major driver of supply-chain changes in the past two decades, growing from 1.3% of retail sales in 2000 to 14.2% in 2019, driving a 5% per annum rise in small parcel (sub-50 pounds) deliveries while large item (>1,000 pounds) have stagnated. Meanwhile, average length of truck hauls has fallen by 25% over the last 10 years.
Rise of globalization
Maybe the greatest impact has been from globalization.
Global trade flows have grown by an average of 1.4 times the rate of real GDP for the past 150 years, the article states. During what it terms the “golden era of globalization” from 1870 to 1913, world trade rose at 1.6 times the rate of real GDP.
Yet our experience is based on more recent times. From 1990 to 2008, global trade increased at twice the pace of GDP growth, driven by trade agreements like NAFTA and GATT, work by the WTO and the formation of the E.U.
During this time, the United States and many other countries offshored production to low-cost countries.
From 1990 to 2007, imports to the United States from China rose to $356 billion from $16 billion, according to the IMF. Overall, imports increased more than four times to $2.2 trillion over this period. Offshoring led to fewer shipments of raw materials and intermediate goods within the United States and to lower inventory volumes.
These developments put downward pressure on intra-U.S. freight volumes.
Energy boom
While raw materials were hauled less and, relative to GDP, less was manufactured in the U.S. one industry boomed: the U.S. energy sector (particularly oil and gas), which significantly boosted domestic freight tonnage.
By 2019, the article states, fracking had lifted U.S. production of oil and other petroleum liquids to 19.5 million barrels per day — the highest in the world. This output, plus new demand for process inputs such as sand and water, boosted truckload carriers, pipelines and inland waterway traffic.
Admittedly, during the same period coal production was in a long decline, with production down from nearly 1.2 billion tons in 2008 to just 756 million tons in 2018.
But it was railroads that were most exposed to the associated freight freefall: coal volumes fell by roughly 10 percentage points as a share of carloads.
Hauling capacity and what comes next
For now, the excess of haulage capacity will represent a headwind for a recovery in haulage costs. But with many freight firms put out of business by the pandemic lockdowns, a reduced industry may face capacity issues down the road.
Meanwhile, for those manufacturers serving the truck trailer market, how the above competing dynamics – some positive, some negative – play out will determine the potential for market recovery in terms of truck trailer demand.
The energy sector will come back, but the scars run deep — not just among the fracking industry but also among investors.
Oil and gas prices will have to recover and prove to be sustainable for significant investment to flow back into the tight oil and gas market.
Globalization is a huge unknown: will firms increase the pace of the reshoring we saw early signs of before the pandemic? Or will they simply switch from sources like China to other southeast Asian markets? Or to Mexico, in search of lower costs rather than maybe invest in automation to fully reshore to the U.S.?
Metal prices fluctuate. Key is knowing when and how much to buy with MetalMiner Outlook. Request a free trial.
It is too early to tell, but McKinsey’s analysis suggests both history and the balance of probabilities are stacked against a renaissance for inland road haulage.


Leave a Reply