Copper MMI: Copper Prices Slide Despite Supply Deficit

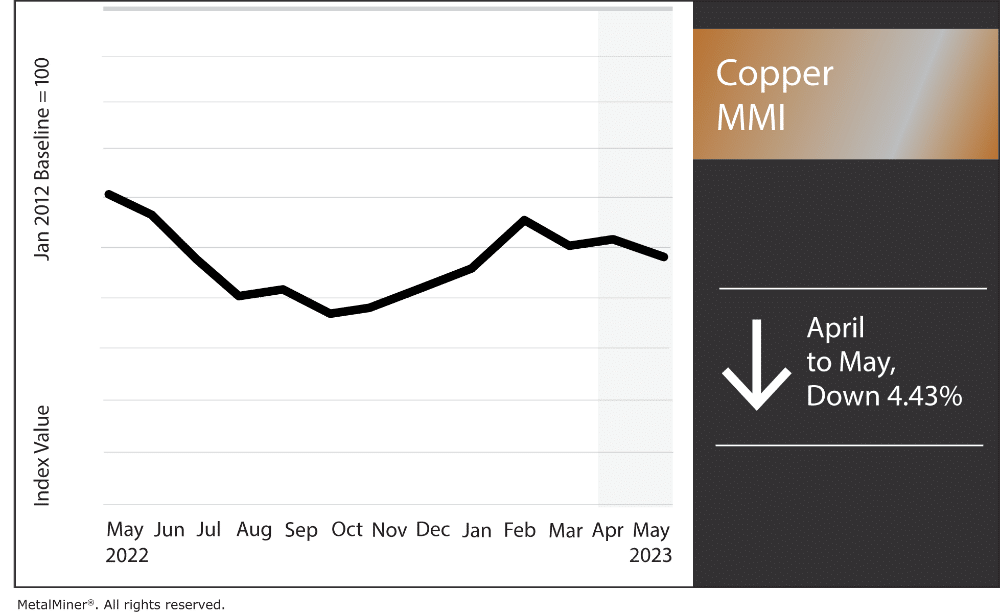
Copper prices continued to slide this past month, although not enough to trigger a downward trend. As lower lows have yet to form, price direction remains uncertain. Copper prices will likely stay within range until a breakout or breakdown in price occurs. Such an event will likely help drive prices in a more established market direction.
Overall, the Copper Monthly Metals Index (MMI) fell 4.43% from April to May.
MetalMiner’s May interactive chat is happening tomorrow at 11:00 AM CST! Learn about unconventional metal cost-reduction tools which your competitions might not know about! Join “How to Use Unconventional Cost Reduction Tools”

China’s Slow Recovery Dragging on Copper Prices
A long-term projected supply deficit remains the overwhelming narrative for the copper market. However, copper prices appear far from bullish. Indeed, since mid-January, prices have continued to demonstrate a slow drift to the downside, falling almost 9% from their peak. It’s true that the global shift toward renewables will continue to add support. However, apparent softness in China’s recovery has added a new drag, thus far preventing any obvious bullish breakout.
While ongoing, China’s returned demand has largely benefited its services sector. This is far different from commodity-driven recoveries in years past. According to the General Administration of Customs, imports of unwrought copper and copper products fell 12.5% from the previous year in April. Beyond copper, imports overall saw a sharp year-over-year contraction last month. Customs data showed a 1.4% decline in imports during March, followed by a 7.9% decline in April. Meanwhile, export demand appeared to moderate also, slowing from a 14.8% year-over-year jump in March to a softer 8.5% rise in April.

The increasingly gloomy outlook is due, in part, to the ongoing contraction of China’s manufacturing sector. For instance, the Caixin General Manufacturing PMI dipped beneath market expectations from a flat 50.0 in March to 49.5 in April. While firms reported stable export demand, domestic demand proved weak. Indeed, new orders fell for the first time in three months. Meanwhile, output rose only slightly as both input costs and selling prices dropped at the fastest rate in over seven years.
Recessionary times make it difficult to map out copper spend wisely, especially with spending freezes. MetalMiner Insights significant reduces this risk by providing copper price forecasting and advice about when and when not to purchase metal. Schedule a consult.
Global Copper Smelting Slows Amid Supply Deficit
While apparent weakness in China has come as a relief to copper prices, supply remains tight. According to the International Copper Study Group (ICSG), 2022 saw an estimated 431,000-ton supply deficit. Back in October, the ICSG projected the market would return to surplus in 2023 by around 155,000 tons. However, the group adjusted its yearly forecast to a 114,000-ton shortfall in April.
Since the ICSG’s October forecast, China returned from zero-COVID. This impacted the new outlook significantly. Indeed, the ICSG noted that “better expectations for China’s usage as compared to the Group’s previous forecast” helped sway this year’s expectations. Despite recent weakness, the ICSG predicts China’s “apparent usage” of refined copper will rise by 1.2% in 2023 and 2.6% in 2024. The group expects a rise in global use as well. Meanwhile, supply has faced several challenges throughout the year, particularly in South America.

Smelting has also come under pressure, which will further burden tight supply. In April, global smelting activity fell to its lowest level since March 2021. Indeed, the global copper dispersion index from Earth-i showed smelter activity remained in contraction, falling from 46.8 in March to 44 in April. Beyond lackluster demand in China, a number of smelters continue to work through maintenance-related outages. These include a 75-day outage at Indonesia’s PT Smelting Gresik and an outage at Aurubis’ Pirdop smelter in Bulgaria. Further West, North America also showed a slowdown in activity. Ultimately, the regional index fell to its lowest level since July 2020 at 24.2.
Make sure you are following the 5 best practices for sourcing copper.
Chile Mining Royalty Bill Moves to Senate
On the supply side, Chile’s senate approved a new mining royalty bill. The move came after the Senate’s finance committee reached a deal with lawmakers to lower the top tax rate for major copper producers. The bill will now proceed to the lower chamber for a final vote this week. In its initial proposal, the bill aimed for a tax ceiling of 50%. However, the government agreed to reduce the top tax rate to 46.5% from 47% for companies producing over 80,000 tonnes of fine copper annually, and 45.5% for those producing between 50,000 and 80,000 tonnes. The current tax burden for miners in Chile ranges from 41% to 44%, which is the same in Peru, Chile’s leading competitor.

The mining royalty bill, which forms part of the government’s broader tax system reform plan, would also establish a 1% ad valorem tax on copper sales for companies exceeding 50,000 tonnes of fine copper. This is in addition to a tax based on the miner’s operating margin ranging from 8% to 26%.
Despite the adjustments made to the original proposal, the Chilean National Mining Society (Sonami) expressed concerns that the bill’s overall tax burden on the mining sector remains higher than in competing countries. With the world facing a projected multi-year supply deficit, this could discourage mining investment in the region. It could also add a new upside pressure to copper prices. According to data from the U.S. Geological Survey, Chile remains the largest global producer, accounting for 24% of global copper output in 2022.
Don’t miss out. Join the MetalMiner LinkedIn group today for news on aluminum, steel, and copper (oh my!).
Copper Prices: Biggest Moves April to May
- Korean copper strip prices saw the only increase in the index, albeit a modest one. Prices rose 0.9% to 10.74 per kg as of May 1.
- Meanwhile, U.S. grade 102 copper producer prices fell 4.29% to $5.13 per pound.
- U.S. grade 110 and 122 copper producer prices fell 4.47% to %4.91 per pound.
- Japanese primary cash copper prices fell 4.98% to $8,709 per metric ton.
- LME primary three-month copper prices fell 5.01% to $8,586 per metric ton.


Leave a Reply