Copper MMI: Copper Prices Drift Upward Despite Stock Surplus

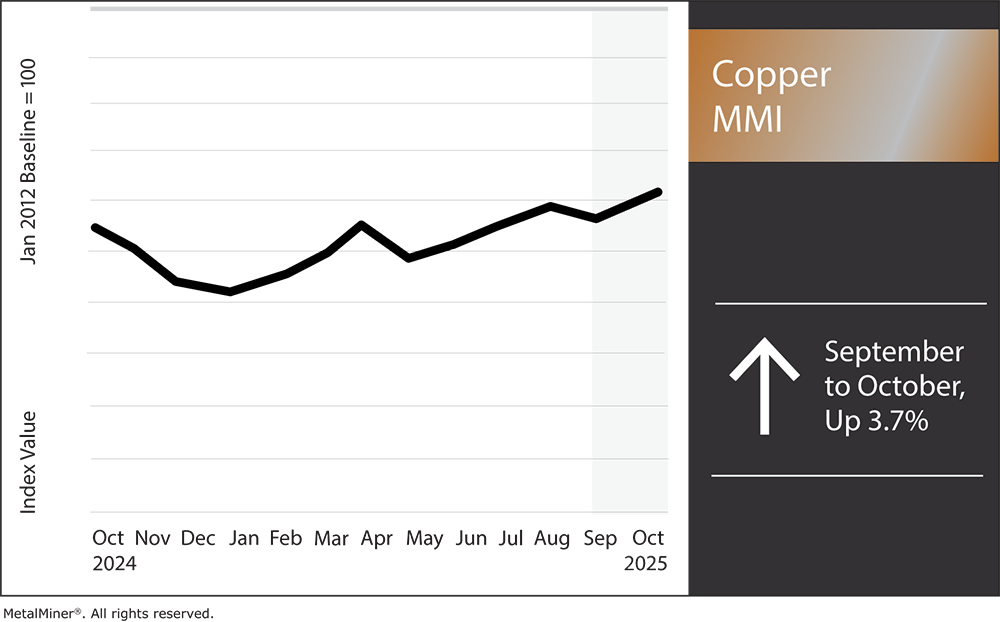
The Copper Monthly Metals Index (MMI) broke above range, with a 3.7% rise from September to October. This comes as copper prices, along with many other metals, continue to show an upside bias.
Copper Joins Other Base Metals in Upward Trend
Comex copper prices hit a two-month high, barreling past the 11k per metric ton mark by early October. LME copper prices lagged behind their Comex counterparts, but traveled upwards in tandem nonetheless. As of October 10, Comex and LME prices had bounced 17% and 12% from where they stood at the start of August.
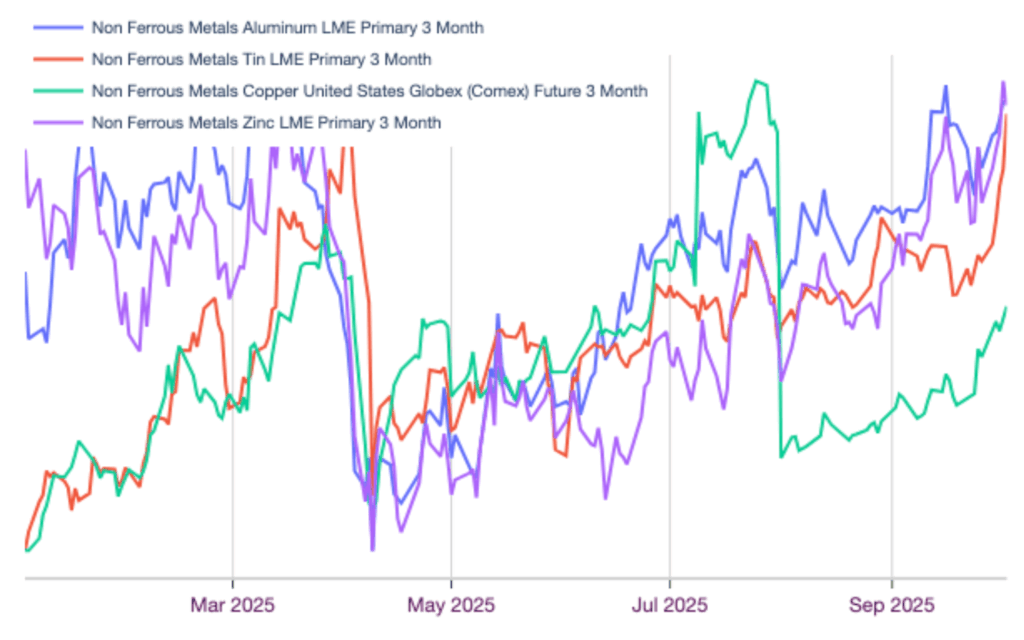
The copper price ascent is not unique to the metals category. Aluminum, zinc and tin prices have witnessed a similar upside drift over the past few months. While each market faces unique drivers, the recent, albeit modest, weakening of the U.S. dollar index has renewed some optimism across base metals. The trend remains intact despite ongoing global economic headwinds that constrain demand outlooks.
Need insights into the drivers behind the price of copper in order to protect your bottom line? MetalMiner’s Monthly Metals Index Report provides detailed price trends for 7 metal sectors, including copper, stainless steel, aluminum and nickel.
Copper Prices Face Mixed Drivers
While they remain short of their all-time highs, bullish fundamentals have underpinned the overall appreciation in copper prices over the past few years. Though data centers and raw material constraints remain a bullish driver for copper, global economic headwinds and downwardly revised expectations from renewables have triggered a softer outlook.
China Rolls Back Solar Support
Renewables and net-zero targets meant the world would require a significant volume of copper. Therefore, the U.S., China and Europe all placed a considerable amount of capital in that direction. But by 2025, those investments had begun to stall. The U.S. shifted its priorities elsewhere as the Trump administration took office, while China has begun to roll back support measures for its solar sector.

China moved to rescind some of its generous solar subsidies in mid-2025. This included ending fixed feed-in tariffs, shifting new projects to market-based electricity prices and requiring distributed solar installations to prioritize self-consumption. The moves triggered a sudden rush to build projects ahead of the deadline, which was followed by a sharp drop in installations once the subsidy incentives were removed.
In the short term, this front-loading inflated demand for solar modules, panel components and associated metals. This included the copper used in wiring, inverters, mounting structures and grid interconnections. This, in turn, led to elevated copper consumption and upward price pressure. But in the longer term, the weaker economics under market-based pricing, rising module prices and stricter regulatory discipline are likely to slow the pace of new solar installations. As a result, developers may defer or cancel projects that aren’t financially viable without subsidies.
Don’t obsess about forecasted copper prices. It’s more important to understand underlying trends. See why.
What’s Next for Copper in China?
The initial subsidy era drove steep growth in copper use via the massive expansion of solar deployment. However, with subsidies ending, the growth rate of copper demand tied to solar in China may moderate. This suggests a peak or plateau in copper demand from the solar sector. Assuming solar continues growing over the next several years, but at a slower rate, copper demand from that sector will still increase, only less dramatically. It could even face downward pressure if competing technologies or policy constraints dampen solar deployment.
The bottom line is that ending subsidies will likely cause a significant one-time spike in installations and copper demand as developers front-load projects. This will be followed by a materially slower growth rate. In terms of China’s copper consumption vs. the “continued-subsidy” baseline, this will translate into hundreds of thousands of tons per year of upside during the rush or downside afterwards.
Mine Disruptions Offer Support
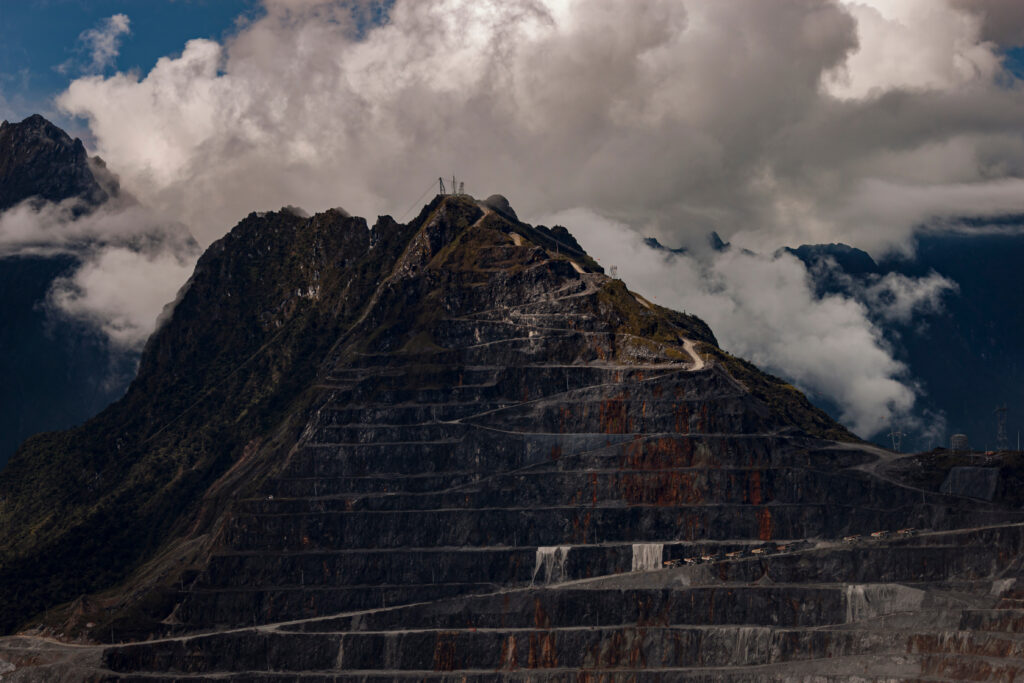
Indonesia’s Grasberg mine has recently experienced disruptions due to mudslide damage and fatal accidents. The September incident and subsequent force majeure at the Freeport-McMoRan-owned facility have significantly tightened global copper supply, contributing to one of the largest supply shocks in years. Currently, production remains curtailed, with recovery timelines for full capacity extended into 2027.
As the world’s second‐largest copper mine, Grasberg saw its operations suspended, with output now expected to drop by roughly 250,000–260,000 metric tons in 2025 and 270,000 tons in 2026 relative to earlier guidance. Estimates suggest the cumulative production loss could reach ~591,000 tons over the period through the end of 2026. As a result, the global copper market has shifted from a small forecasted surplus into a deficit on the order of ~400,000 tons in 2026 alone.
Frustrated with one-size-fits-all subscriptions? MetalMiner Select offers customizable access to individual metal prices or bundled packages, ensuring you pay solely for the forecasts that matter to your procurement strategy.
Copper Prices React to Grasberg Incidents
Copper prices were quick to react to the Grasberg news. For instance, prices on the London Metal Exchange surged roughly 3–3.5% on the day of the announcement. The incident has also led to upward revisions in price forecasts. Banks like Goldman Sachs, Citi and others now expect copper prices to remain elevated, with some estimates for 2026–2027 reaching $11,000-$14,000/ton. Such price forecasts reflect both the lost supply and the tight outlook.

That said, mine disruptions are nothing new to the copper market. Declining ore quality and the absence of meaningful mine growth remain long-term obstacles for the copper industry. While this is due in part to the sharp ramp-up of smelting capacity in China, treatment and refining charges remain at record lows, suggesting material tightness.
Due to its unprecedented scale, Grasberg’s mine disruption offered a sharp reminder that raw material constraints remain a fixture within the market. The event also triggered Europe’s largest copper smelter, Aurubis, to increase its premium to $315 per metric ton, a new record high.
What’s Next For Copper Prices?
Back in 2024, concerns over copper supply, which was at least partially influenced by tight conditions in the raw material market, helped spur a significant uptrend in copper prices. That year saw prices jump 38% before the 3-month uptrend ultimately failed.
However, the upward movement ultimately proved speculative, as markets were forced to reconcile with refined supply conditions, which turned out to be ample. As the market enters Q4 2025, the global copper market remains well-supplied, which will offer a headwind to recent upside price action.

In the months ahead, demand conditions will ultimately determine whether copper prices can maintain their bullish bias. While supply-side disruptions remain a long-term threat, they alone are not enough to meaningfully affect current market conditions. Read MetalMiner’s price outlook in this month’s Monthly Metals Outlook. The report provides both short-term and long-term forecasts, along with buying strategies, giving you the edge to navigate market volatility and maximize cost savings. See a free sample report and opt into a subscription.
Biggest Copper Price Moves
- U.S. copper producer prices for grades 110 and 122 witnessed the largest increases of the overall index, rising 5.94% to $6.06 per pound as of October 1.
- U.S. copper producer prices for grade 102 experienced a similar 5.7% rise to $6.31 per pound.
- LME primary three-month copper prices increased 5.54% to $10,880 per metric ton.
- Chinese copper wire prices rose by 4.99% to $11,690 per metric ton.
- Korean copper strip prices witnessed the only decline of the overall index, albeit a modest one. Prices ultimately fell 0.43% to $11.80 per kilogram.