Aluminum buyers are understandably nervous about the future price direction following the near 9% fall in prices from a high in early January. Buying Aluminum in 2018? Download MetalMiner’s free annual price outlook Aluminum on the Shanghai Futures Exchange closed at the lowest level this week in 14 months, particularly unsettling as the industry had […]
It’s that time — our latest Monthly Metals Index (MMI) report is in, covering the second month of 2018. Momentum from the start of the year slowed considerably in this round of readings.Need buying strategies for steel? Try two free months of MetalMiner’s Outlook Four MMIs held at the same reading as the previous month (Automotive, […]
This month, zinc prices started to trade lower, returning to the $3,200 level. This activity represents the first short-term price pullback we’ve seen in zinc prices since June 2017, when prices started their latest rally. Need buying strategies for steel? Try two free months of MetalMiner’s Outlook But going back even further, the zinc price […]
Cobalt may be a minor constituent of lithium ion batteries, but it is a crucial one. Need buying strategies for steel? Try two free months of MetalMiner’s Outlook Lithium has been the metal in the news this year. Bolstered by rising demand for hybrid and electric cars, however, the supply market has been struggling to […]
The Stainless Steel MMI (Monthly Metals Index) traded flat in March after a big jump in February. The current reading is 75 points. Need buying strategies for steel? Try two free months of MetalMiner’s Outlook
The index remained flat as LME nickel prices decreased slightly, while other elements of the stainless steel basket increased. Stainless steel surcharges jumped again this month, largely following the previous month’s LME nickel price movements. LME Nickel
Nickel momentum appears to have slowed since the beginning of March. Prices retraced slightly. However, nickel prices remain in a strong, long-term uptrend.
[caption id="attachment_90804" align="aligncenter" width="580"] Source: MetalMiner analysis of FastMarkets[/caption]
Like copper prices, nickel prices remain above the blue dotted line above. In December, nickel prices rallied and started to trade with a sharper slope, following the purple dotted line.
However, these movements are often not sustainable in the long-term trend, and commonly correct. Therefore, nickel prices retraced to their long-term trendline, while trading volume remains supportive of the uptrend. Domestic Stainless Steel Market
Following the recovery in stainless steel momentum, domestic stainless steel surcharges increased further this month.
The 316/316L-coil NAS surcharge breached its previous $0.8/pound ceiling. Stainless steel surcharges increased again rapidly. Therefore, buying organizations will want to look at surcharges to identify opportunities to reduce price risk either via forward buys or hedging.
[caption id="attachment_90805" align="aligncenter" width="580"] Source: MetalMiner data from MetalMiner IndX(™)[/caption] Tariffs Do Not End in the U.S.
The European Commision prolonged the already existing anti-dumping measures on Chinese imports of stainless steel seamless pipes and tubes for another five years. The duties imposed initially in 2011 ranged from 48.3% to 71.9%. These duties gave European stainless steel producers — like France, Spain and Sweden — some breathing room.
The review of these measures started again in December 2016 and showed the removal of duties on Chinese products would harm European producers.
Therefore, the European Commission agreed to maintain the current duties on pipes and tubes used in the chemical and petrochemical industries for another five years.
Although the Europeans have not enacted broad tariffs like the U.S. has done via Section 232 of the Trade Expansion Act of 1962, the issue of global overcapacity remains paramount as the E.U. continues to implement heavy duties on stainless steel products to limit imports. What This Means for Industrial Buyers
Stainless steel momentum appears stronger this month, recovering from its previous weakness.
As both steel and nickel remain in a bull market, buying organizations may want to follow the market closely for opportunities to buy on the dips.
To understand how to adapt buying strategies to your specific needs on a monthly basis, take a free trial of our Monthly Outlook now.
Buying organizations who have concerns about the Section 232 impact on the steel industry may want to read our comprehensive Section 232 Report, which includes new data. MetalMiner’s Annual Outlook provides 2018 buying strategies for carbon steel Actual Stainless Steel Prices and Trends
The impact of the president’s Section 232 proclamation applying a 25% import duty on all steel articles with HTS codes 7206.10 through 7216.50, will have a somewhat predictable impact on steel prices (they will increase, at least in the short term). Need buying strategies for steel? Try two free months of MetalMiner’s Outlook The impact on grain-oriented electrical steel (GOES) buying organizations, MetalMiner believes, will not exactly mirror the broader impact of the tariffs on commonly purchased steel forms, alloys and grades. But first, the reaction to the announcement of the steel tariffs from Roger Newport, the CEO of AK Steel, and the last remaining GOES producer in the U.S.: “We support President Trump for taking the bold action of imposing a 25% global tariff on steel to defend America’s steel industry and its workers from imports that threaten our national and economic security,” he said. “Nowhere is this threat more evident than in electrical steel where AK Steel is now the only domestic producer of electrical steel for electrical transformers. Years of surging imports and the subsequent market volatility caused the only other U.S. producer to exit the market in 2016. This action by the President could not come soon enough as the surge of electrical steel imports continued throughout last year, with imports nearly doubling in 2017 when compared to 2016.” GOES Markets Are More Nuanced Than Other Flat Rolled Products Markets GOES markets serve as an example of where and how certain sub-segments of the steel industry will attempt to carve out exceptions and/or exemptions from the tariff proclamation — specifically, under point 11 of Trump’s proclamation. MetalMiner believes that Japanese producers, along with their importing partners and customers, will petition the Department of Commerce for an exception by proving that certain highly engineered grades of electrical steel are not in fact produced in the United States. The president’s proclamation identifies the procedure by which exceptions can be made:
The Secretary, in consultation with the Secretary of State, the Secretary of the Treasury, the Secretary of Defense, the United States Trade Representative (USTR), the Assistant to the President for National Security Affairs, the Assistant to the President for Economic Policy, and such other senior Executive Branch officials as the Secretary deems appropriate, is hereby authorized to provide relief from the additional duties set forth in clause 2 of this proclamation for any steel article determined not to be produced in the United States in a sufficient and reasonably available amount or of a satisfactory quality and is also authorized to provide such relief based upon specific national security considerations. Such relief shall be provided for a steel article only after a request for exclusion is made by a directly affected party located in the United States.
Clearly, the impact of imports on the domestic GOES market has come on the back of rising and significant Japanese imports. China and South Korea are non-players for GOES into the U.S.
[caption id="attachment_90783" align="aligncenter" width="580"] Source: International Trade Administration and MetalMiner Analysis[/caption] The real question involves whether or not customers of Japanese products will be able to prove that the materials they are buying from Japan, are indeed not produced in the U.S. The president has mandated that the secretary of commerce issue procedures for requests for tariff exclusions within 10 days of the proclamation date (which was March 8). MetalMiner’s Annual Outlook provides 2018 buying strategies for carbon steel Exact GOES Coil Price This Month
Before we head into the weekend, let’s take a look back at the week that was and some of the headlining stories here on MetalMiner: Need buying strategies for steel? Try two free months of MetalMiner’s Outlook How did the rest of the world react to President Donald Trump’s initial announcement last week about steel […]
The Raw Steels MMI (Monthly Metals Index) increased 7% this month, reaching 92 points. This reading is the highest since June 2012. The skyrocketing MMI came as a result of sharp increases in steel prices, the Section 232 release and President Trump’s comments regarding imposition of a 25% steel tariff. Need buying strategies for steel? Try two free months of MetalMiner’s Outlook
Steel price momentum strengthened in February, moving sharply up for all forms of steel. Steel prices have reached more than three-year highs. However, some forms of steel are now even higher. Domestic HRC prices, currently at $762/st, haven’t seen these levels since June 2011.
[caption id="attachment_90758" align="aligncenter" width="580"] Source: MetalMiner data from MetalMiner IndX(™)[/caption]
Based on the long-term analysis, steel prices will likely continue to rise this year. Even if the seasonality for steel prices returns in Q2, steel price momentum appears strong. Let’s Talk Spreads
Section 232 — and the price uncertainty it has unleashed — requires metal-buying organizations to pay more attention to what is called the spread. The spread refers to the price delta between domestic HRC and CRC prices and the spread of each with Chinese prices. Analyzing and understanding these spreads helps to determine by how much mills could increase steel prices (as well as how high they can go).
So, let’s take a look at some examples. The Domestic HRC-CRC Spread
As with all the other forms of steel, CRC prices also increased again this month. The upward movement remains strong, even if the amount of the increases — and therefore the slope of the upward trend — appears softer (less sharp).
This does not come as a surprise, as the spread between CRC and HRC prices was extremely high. Now, the spread between CRC and HRC prices has returned closer to historical levels.
[caption id="attachment_90759" align="aligncenter" width="580"] Source: MetalMiner data from MetalMiner IndX(™)[/caption]
It is important to understand where the spread comes from. CRC (cold rolled coil) is HRC (hot rolled coil) plus one additional rolling process. As per the chart above, from 2011 to 2016 the price spread between the two has been around $100/st (plus or minus).
At the end of 2016, buying organizations could see a $201/st spread between HRC and CRC prices. The spread started to decline at the beginning of 2017, and has increased further in 2018. The domestic spread is currently at $124/st, much closer to its historical levels. (MetalMiner covered domestic spreads in our free Annual Outlook Report published in October 2017.)
A higher spread creates better margins for domestic mills. From a buying perspective, the previous anomaly only helps a buying organization that has not contracted for all of its CRC purchases (and can play a price arbitrage game by purchasing HRC and paying to roll it to CRC). Chinese Spread
Chinese demand has always been positioned as one of the main drivers of global steel prices. Check out the correlation in the graph below between the domestic HRC and Chinese HRC prices. When Chinese prices increase, U.S. domestic prices tend to increase, too. The same is usually true when prices fall.
[caption id="attachment_90760" align="aligncenter" width="580"] Source: MetalMiner data from MetalMiner IndX(™)[/caption]
Even if short-term events (such as the release of the Section 232 report or President Trump’s comments) add support to steel prices in one country, the general trends tend to correlate.
This is exactly what happened with U.S. HRC prices.
The latest increase in HRC prices here in the U.S. came as a result of the Section 232 uncertainty and the announcement of the tariff. Not surprisingly, so far this month, HRC prices in China increased after trading sideways last month. Therefore, watching price reactions in China makes sense in order to better forecast price trends in the U.S.
An analysis of the spread between Chinese and U.S. prices allows buying organizations to better understand the price impacts the tariffs could have on domestic steel prices. In other words, the spread tells us how much domestic prices could rise before it is better to import steel from China. What This Means for Industrial Buyers
The strong upward momentum for steel, together with the Section 232 outcome and President Trump’s comments regarding steel tariffs, drove steel prices to more than three-year highs. Buying organizations who have concerns about the Section 232 impact on the steel industry may want to read our Section 232 Report. MetalMiner’s Annual Outlook provides 2018 buying strategies for carbon steel Actual Raw Steel Prices and Trends
[caption id="attachment_88708" align="alignleft" width="300"] Chris Titze Imaging/Adobe Stock[/caption]
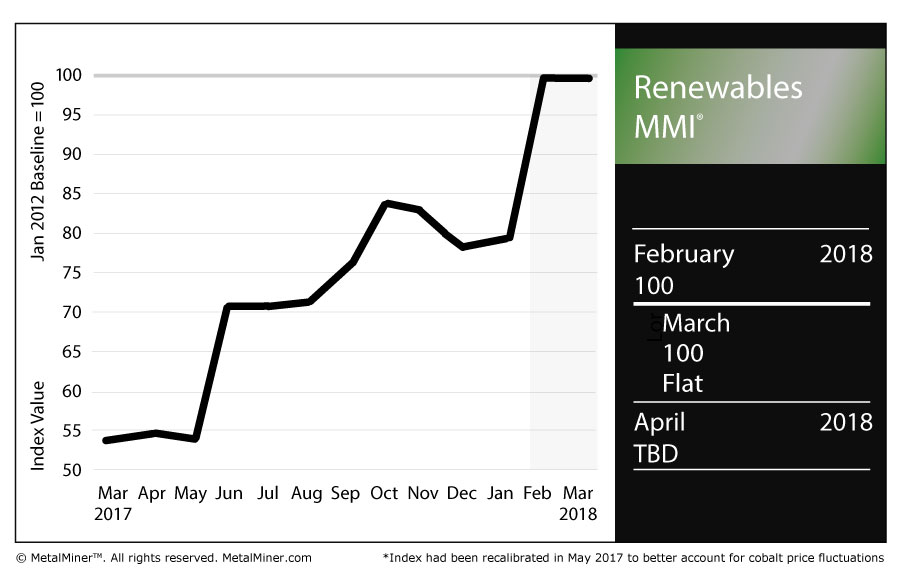
The Renewables MMI (Monthly Metals Index), after a significant surge last month, sat at 100 for the second consecutive month. Need buying strategies for steel? Try two free months of MetalMiner’s Outlook
Within this basket of metals, the Japanese steel plate price rose, as did the price of Chinese and American steel plate. U.S. steel plate, in fact, rose 5.5% month over month.
U.S. grain-oriented electrical steel (GOES) coil also jumped in price.
As for the trio of rare and minor metals in this MMI, cobalt cathodes fell 1.1%, while silicon dropped slightly and neodymium made a small gain.
Cobalt Costs
According to a report by the Financial Times, changes to the mining code in the Democratic Republic of Congo will lead to higher costs for consumers of the metal.
According to the report, President Joseph Kabila on Wednesday said he would sign a new order after meeting with representatives from some of the big miners with business in the country, including Glencore, Molybdenum and Ivanhoe Mines.
Cobalt is used in batteries for electric vehicles (EVs), among other things, making it an especially prized material as EVs gain popularity. As such, with a majority of the world’s cobalt being mined in the DRC, political machinations in the country have a significant impact on the metal’s price.
According to the Financial Times, the code could see royalties on cobalt — plus other metals, like copper and gold — rise from 2% to 10%.
Senators Lobby for Electrical Steel Protection in 232
The Journal-News reported on a trio of U.S. senators who lobbied Trump to prioritize electrical steel in the Section 232 trade remedy process.
The only remaining maker of electrical steel in the country, AK Steel, was unlikely to benefit from the Section 232 trade remedy proposal, according to Sen. Rob Portman (R-OH).
“We write you today to share our concerns that your proposed section 232 remedy is incomplete when it comes to electrical steel,” Portman and two other senators said in their letter to Trump, according to the Journal-News. “We write on behalf of a constituent company, AK Steel, which is the last domestic producer of grain-oriented electrical steel (GOES). Since the remedy, as currently constructed, does not include electrical cores and core parts, the remedy will not be effective for the domestic electrical steel market.”
In the senators’ letter, they requested the president add a trio of HTS codes to the duty order.
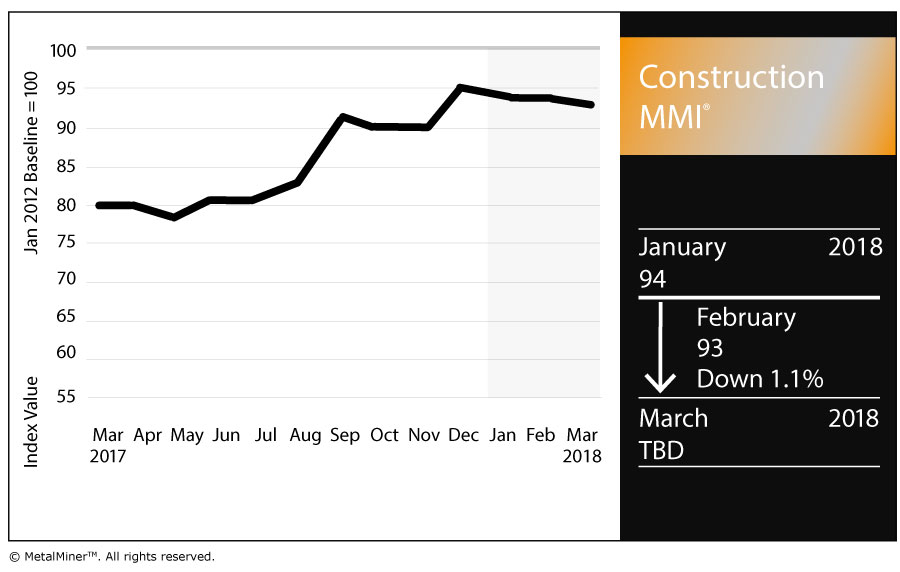
The Construction MMI (Monthly Metals Index) dropped one point this month, falling to 93 for our March reading. Need buying strategies for steel? Try two free months of MetalMiner’s Outlook
Within the basket of metals for the Construction MMI, Chinese rebar and H-beam steel prices dropped on the month. Meanwhile, U.S. shredded scrap steel rose 8.4% on the month, while European commercial 1050 sheet fell 3.0%.
Chinese aluminum bar also fell, dropping 1.0% month over month.
U.S. Construction Spending
According to U.S. Census Bureau data for January, total spending stood pat from December, but was up year over year.
Construction spending during January 2018 was estimated at a seasonally adjusted annual rate of $1,262.8 billion, up minimally from the revised December estimate of $1,262.7 billion, according to the Census Bureau.
The January figure, however, was up 3.2% from January 2017’s $1,223.5 billion.
Meanwhile, spending on private construction was at a seasonally adjusted annual rate of $962.7 billion, 0.5% above the revised December estimate of $967.9 billion.
Under the umbrella of private construction, residential construction was at a seasonally adjusted annual rate of $523.2 billion in January, 0.3% above the revised December estimate of $521.8 billion. Nonresidential construction was at a seasonally adjusted annual rate of $439.6 billion in January, 1.5% below the revised December estimate of $446.2 billion.
As for public construction, the estimated seasonally adjusted annual rate of public construction spending was $300.1 billion, 1.8% above the revised December estimate of $294.8 billion.
Within that, educational construction was at a seasonally adjusted annual rate of $76.7 billion, 2.1% above the revised December estimate of $75.2 billion. Highway construction was at a seasonally adjusted annual rate of $92.6 billion, 4.4% above the revised December estimate of $88.8 billion.
Construction and Tariffs
Just like other metal-using sectors, the construction industry would also be impacted by President Trump’s announced steel and aluminum tariffs (especially steel).
Trump’s announcement came just over a month after Trump proposed $1.4 trillion in infrastructure investment over 10 years.
For a construction industry that saw spending flatten in January, a rise in materials costs would not be great news, should the tariffs become the law of the land.
According to Philip Gibbs, an analyst at KeyBanc Capital, the tariffs might give steel stocks a short-term “sugar high,” he told Reuters, but that unsustainable pricing could eat into demand from manufacturers.
The National Association of Homebuilders (NAHB) came out against the tariffs proposal, with the association’s chairman saying the tariffs would hurt consumers and make housing less affordable.
“It is unfortunate that President Trump has decided to impose tariffs of 25 percent on steel imports and 10 percent on aluminum imports,” said Randy Noel, chairman of the NAHB. “These tariffs will translate into higher costs for consumers and U.S. businesses that use these products, including home builders.
“Given that home builders are already grappling with 20 percent tariffs on Canadian softwood lumber and that the price of lumber and other key building materials are near record highs, this announcement by the president could not have come at a worse time.”
Of course, the metals world is still in wait-and-see mode regarding the tariffs, which have yet to become actual law.