This afternoon, President Trump signed a proclamation to impose the 25% tariff on imported steel and 10% tariff on imported aluminum products, both of which were announced on March 1. The tariffs will go into effect in 15 days, and will exclude Canada and Mexico for the moment, until NAFTA negotiations finish, according to several […]
Irene Martinez Canorea
Copper MMI: Prices Retrace as U.S. Dollar Firms
The Copper MMI (Monthly Metals Index) traded lower this month, falling two points to 87 for our March reading.
The Copper MMI fell for the second consecutive month, after the sharp increase in prices at the end of last year. In February, LME copper prices fell by 3.5%.
Need buying strategies for steel in 2018? MetalMiner’s Annual Outlook has what you need
The LME copper short-term downtrend does not seem that bearish when looking at the two-year chart. Copper prices retraced this month again, but still hold above the blue dotted line, which represents the trend line (prices below that line might indicate a change in trend). In December, copper prices skyrocketed and breached the $7,000/st level, confirming long-term bullish sentiment remains intact.
[caption id="attachment_90695" align="aligncenter" width="580"] Source: MetalMiner analysis of FastMarkets[/caption]
Meanwhile, this month, a stronger U.S. dollar added downward pressure to commodities and industrial metals. Analysts also claim the latest “bearish” downtrend occurred due to increasing LME stocks.
MetalMiner analyzes copper supply from two different perspectives: copper stocks and global copper supply.
Copper Stocks
Copper stocks at the major metal exchanges totaled 537,722 tons at the end of November 2017, reflecting a decrease of 0.3% from stocks in December 2016. In particular, LME stocks fell by 41%, while SHFE stocks increased by 12% in 2017.
However, 2018 has come with some recoveries for LME copper stocks.
Copper stocks are at a current 324,900 tons. This means LME copper stocks are 13,075 tons higher than at the beginning of 2017, and 85,500 tons higher than at the beginning of 2016.These numbers show some recovery for LME copper stocks; this information has likely fueled trading sentiment this month.
CME stocks also increased at the beginning of the year. In 2015, CME stocks were just at 20,000 tons, compared to the current 209,000-ton level. Both of these numbers (CME and LME stock levels) have moved trader sentiment.
Global Copper Supply
The Indonesian unit of Freeport-McMoran’s copper mine and Amman Mineral Nusa Tenggara (AMNT) are waiting for last-minute ministry approvals to their application for an extension to continue with copper concentrate exports. Freeport’s export order for the Grasberg mine expires this month (copper mines have to reapply for export licenses every year).
Freeport had an export quota of 1.1 million tons of copper ore concentrate ending February 2018. Exports could stop this month, but mine production could continue.
Meanwhile, the Chinese Ministry of Environmental Protection has tightened the “allowable” impurities levels further. Therefore, instead of importing scrap, China now imports unwrought copper for downstream production.
Copper supply also looks threatened in Chile and Peru, particularly if workers go on strike since labor contracts expire soon. The powerful labor union at the Escondida copper mine cast doubt on the chances of starting talks on a new labor agreement with the company before formal negotiations commence in June.
Global copper supply still shows some uncertainty with possible copper supply shortages coming in 2018. Therefore, buying organizations may want to understand the global picture rather than just considering the trend based on stock levels and actual copper supply.
What This Means for Industrial Buyers
In February, buying organizations had some opportunities to buy some volume. As long as copper prices remain bullish, buying organizations may want to buy on the dips. For those who want to understand how to reduce risks, take a free trial now to the MetalMiner Monthly Outlook.
MetalMiner’s Annual Outlook provides 2018 buying strategies for carbon steel
Actual Copper Prices and Trends
Aluminum MMI: Markets React to 10% Aluminum Tariff Proposal
After last month’s increase, the March Aluminum MMI (Monthly Metals Index) fell two points for this month’s reading. A weaker LME aluminum price led to the retracement. The current Aluminum MMI index stands at 97 points, 2% lower than in February.

LME aluminum price momentum slowed this month. Despite the price retracement, trading volumes still support the current uptrend. The long-term uptrend remains in place.
Buying Aluminum in 2018? Download MetalMiner’s free annual price outlook
[caption id="attachment_90675" align="aligncenter" width="580"] Source: MetalMiner analysis of FastMarkets[/caption]
Domestic Aluminum Market
February brought much uncertainty to the domestic aluminum market with the release of the Trump administration’s Section 232 reports and recommendations vis-a-vis aluminum and steel imports. That release, together with President Trump’s announcement last Thursday of a 10% aluminum tariff on all imports have activated price warning systems for all aluminum and aluminum products.
LME aluminum reacted to the news, increasing only slightly.
Additional information about Trump’s announcement, combined with specific buying strategies, can be found in the MetalMiner team’s Section 232 Investigation Impact Report.
On top of that, the U.S. Department of Commerce announced its final determination on the Chinese aluminum foil import case initiated in March 2017. The aluminum foil investigation includes all Chinese aluminum imports, and the anti-dumping margins vary from 48.64 to 106.09%, while the countervailing margins vary in the 17.14-80.97% range. This case may also add some support for LME aluminum prices in the short term.
MW Aluminum Premiums on the Rise
U.S. Midwest aluminum premiums moved again at the beginning of March and are currently trading at $0.16/pound. The U.S. Midwest Premium has now reached the same levels from March 2015; the pace of the increases appears to have accelerated since the Section 232 report release.
[caption id="attachment_90677" align="aligncenter" width="580"] Source: MetalMiner data from MetalMiner IndX(™)[/caption]
The Section 232 outcome and President Trump’s comments around possible import remediation measures have caused increased volatility in the U.S. Midwest premium.
What This Means for Industrial Buyers
LME aluminum price retracement may give buying organizations a good opportunity to buy, as prices may increase again.
In bullish markets, buying organizations still have many opportunities to forward buy. Therefore, adapting the right buying strategy becomes crucial to reducing risks.
Given the ongoing uncertainty around aluminum and aluminum products, buying organizations may want to read MetalMiner’s Section 232 special coverage.
Want to see an Aluminum Price forecast? Take a free trial!
Actual Aluminum Prices and Trends
The Relationship Between CBOE’S Volatility Index and Industrial Metals
A recent article in Crain’s examining an alleged manpulation of the VIX, otherwise known as the Volatility Index, prompted MetalMiner to take a deeper look at the relationship between the index, commodities and industrial metals. Need buying strategies for steel? Try two free months of MetalMiner’s Outlook As a reminder to readers, trading activity and the […]
Stainless Steel MMI: LME Nickel Price, Stainless Surcharges Both Rise
The Stainless Steel MMI (Monthly Metals Index) jumped four points again this month for a February reading of 75.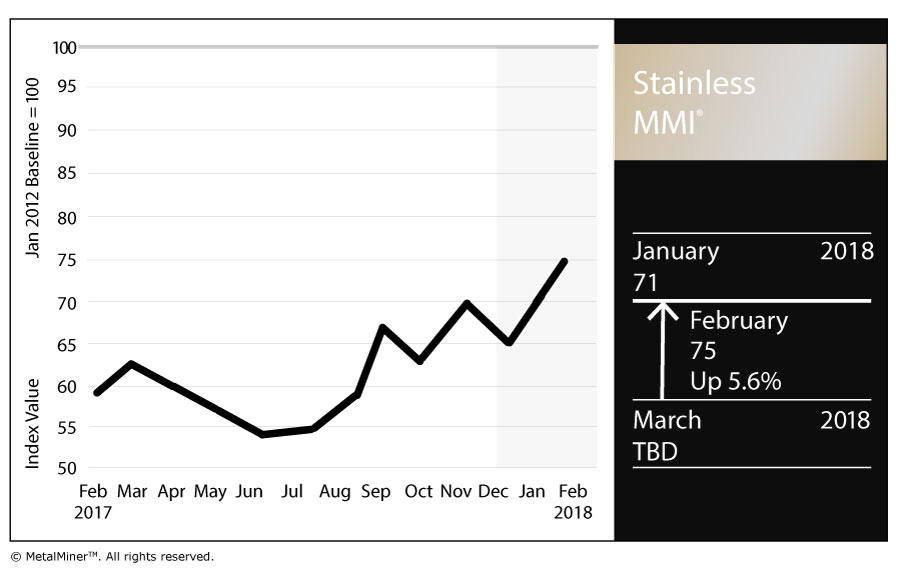
Need buying strategies for steel? Try two free months of MetalMiner’s Outlook
In January, skyrocketing LME nickel prices drove the Stainless Steel MMI. Nickel prices have climbed above the $13,000/mt level. 304 and 316 surcharges increased this month, returning to their previous levels.
LME Nickel
Nickel prices increased sharply during January. However, prices decreased slightly in early February. As reported previously by MetalMiner, nickel price volatility has increased over the past few months. Therefore, nickel prices may prove quite tumultuous from a short-term perspective and are trading within the orange-dotted band in the chart below.
[caption id="attachment_90272" align="aligncenter" width="580"] Source: MetalMiner analysis of FastMarkets[/caption]
The long-term nickel price uptrend also remains strong. Prices have moved toward June 2015 levels and already breached our October 2017 long-term resistance levels, as per our Annual Outlook. Therefore, nickel prices remain in a strong uptrend and could continue increasing in the coming months.
Domestic Stainless Steel Market
Following the recovery in stainless steel momentum, domestic stainless steel surcharges increased this month. Surcharges remain above last year’s lows (under $0.4/pound); they remain in an uptrend, even if their pace has slowed. However, buying organizations may want to look at surcharges closely to reduce risks, either via forward buys or hedging.
[caption id="attachment_90273" align="aligncenter" width="580"] Source: MetalMiner data from MetalMiner IndX(™)[/caption]
FerroChrome vs. Chrome Metal
Two months ago, MetalMiner reported on the anomaly between ferrochrome and chrome metal prices.
[caption id="attachment_90274" align="aligncenter" width="580"]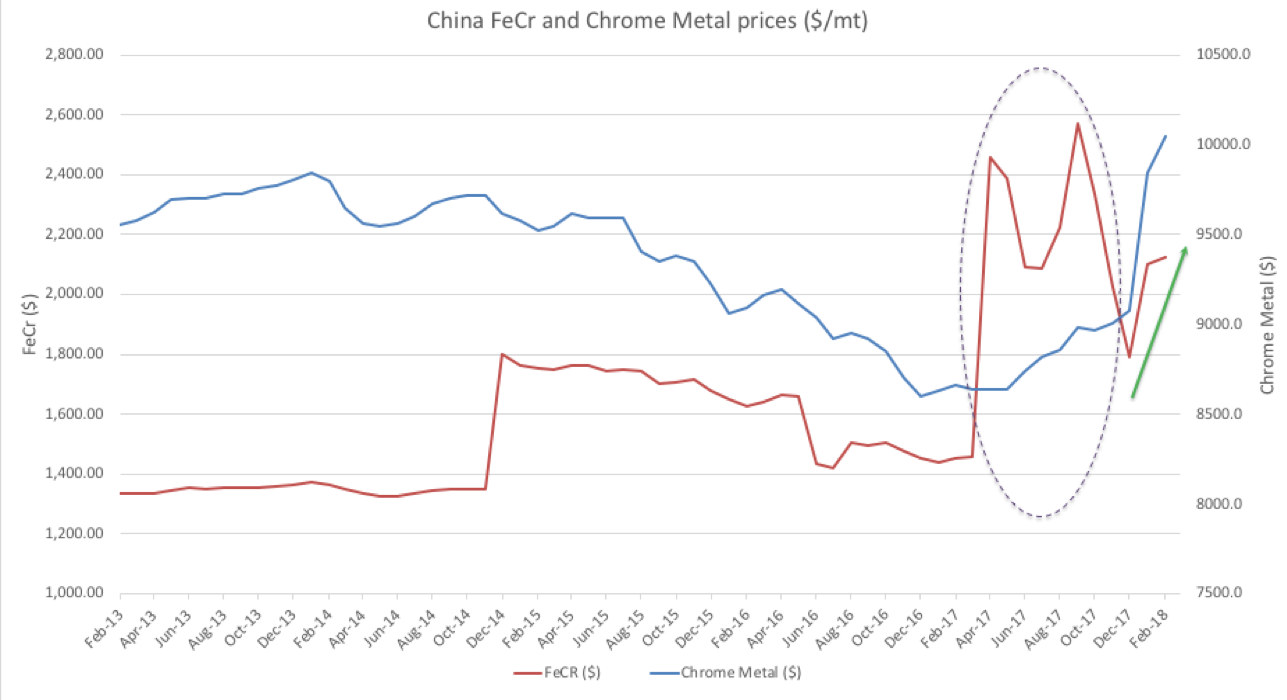 Source: MetalMiner data from MetalMiner IndX(™)[/caption]
Ferrochrome (FeCr) is a chromium and iron alloy containing 50% to 70% chromium by weight. Historically, Ferrochrome and chrome prices correlate tightly but the high iron ore prices caused ferrochrome to spike. However, both prices (ferrochrome and chrome) have fallen back to their historical trading pattern of moving together.
What This Means for Industrial Buyers
Stainless steel momentum appears in recovery, similar to all the other forms of steel. As both steel and nickel remain in a bull market, buying organizations may want to follow the market closely for opportunities to buy on the dips. To understand how to adapt buying strategies to your specific needs on a monthly basis, take a free trial of our Monthly Outlook now.
MetalMiner’s Annual Outlook provides 2018 buying strategies for carbon steel
Actual Stainless Steel Prices and Trends
Raw Steels MMI: HRC Prices Hit Highest Level in More than Two Years
The Raw Steels MMI (Monthly Metals Index) inched three points higher this month, reaching 86 points.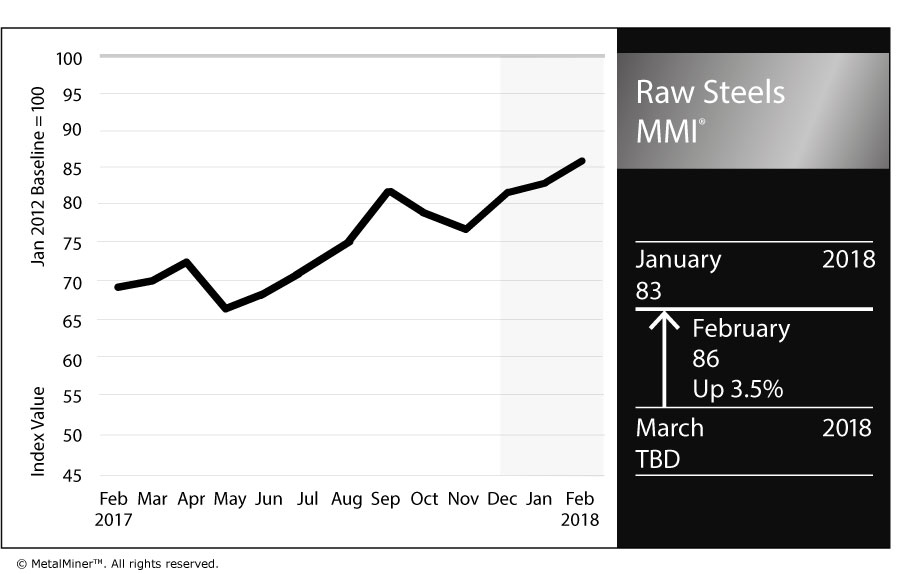
Steel price momentum appears to have continued as prices increased sharply in January. February has already signaled a continuation of this uptrend, with HRC prices breaching the $700/st level. HRC prices have reached the highest levels in more than two years and could continue to climb.
Need buying strategies for steel? Try two free months of MetalMiner’s Outlook
[caption id="attachment_90232" align="aligncenter" width="585"] Source: MetalMiner data from MetalMiner IndX(™)[/caption]
The spread between HRC and CRC prices fell this past month, returning to the $140/st level. Since the beginning of 2016, the spread between HRC and CRC prices increased to around $200/st. The spread has returned to normal levels, with HRC prices increasing more than CRC prices.
President Trump has yet to release results from the Section 232 investigation. Commerce Secretary Wilbur Ross sent his Section 232 steel report to Trump last month; the president has 90 days as of Jan. 11 to act on the report’s findings and recommendations.
Global Steel Sector
According to the World Steel Association (WSA), global production of crude steel increased by 5.3% during 2017. The world map below reflects some of the changes in steel production by country and the impact on total steel output.
[caption id="attachment_90233" align="aligncenter" width="585"]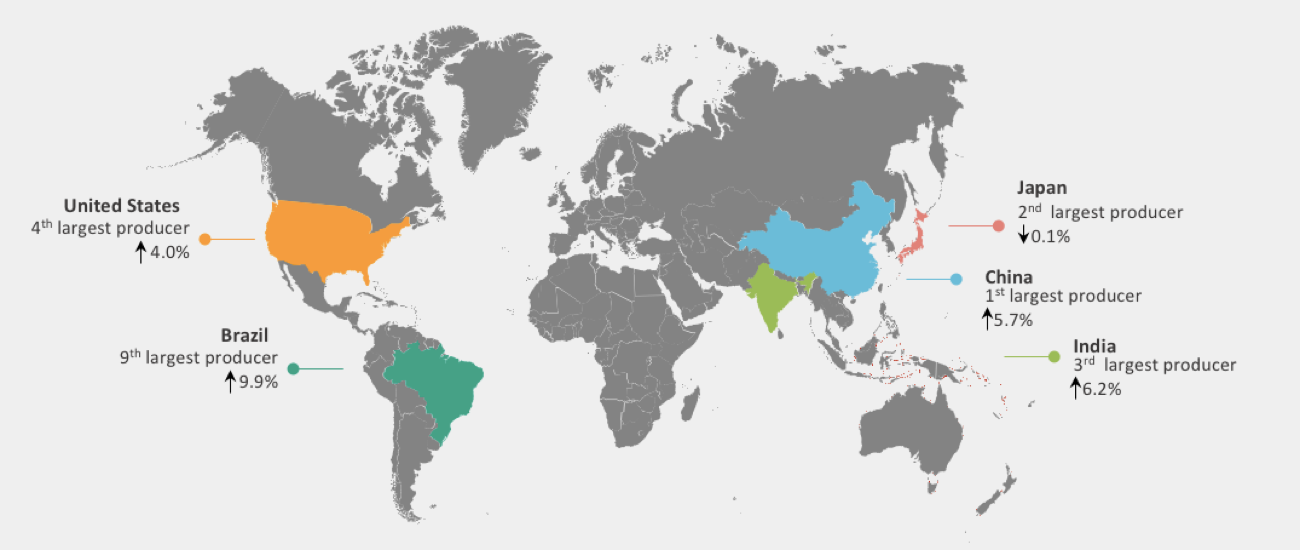 Source: MetalMiner analysis of WSA data[/caption]
Chinese global production of crude steel increased by 5.7%. However, China’s exports fell to 75.4 million tons last year from the previous 108.5 million tons. Japanese production of crude steel decreased by only 0.1%, while U.S. crude steel production increased by 4%.
According to Eurofer, European steel demand could increase by 1.9%. In 2017, European steel imports fell by 1% due to defensive trade measures.
Shredded Scrap
Shredded scrap prices increased again in January, shifting the latest short-term downtrend to an uptrend. The long-term uptrend remains in place, and scrap prices have now moved together with U.S. steel prices.
What This Means for Industrial Buyers
As steel price dynamics showed a strong upward momentum this month, buying organizations may want to understand price movements to decide when to commit mid- and long-term purchases. Buying organizations with concerns about the Section 232 outcome and its impact on the steel industry may want to take a free trial now to our Monthly Metal Buying Outlook. Our Monthly Outlook will include a detailed analysis of the Section 232 outcome.
For more efficient carbon steel buying strategies, take a free trial of MetalMiner’s Monthly Outlook!
Actual Raw Steel Prices and Trends
Copper MMI: Copper Prices Cool After December Surge
The Copper MMI (Monthly Metals Index) traded lower this month, falling one point for a February reading of 87. The fall was driven by a slight retracement of copper prices, which had skyrocketed in December. In January, LME copper prices fell by 1.21%.
Despite the price retracement, LME copper prices held above the $7,000/mt level at the beginning of February, and fell below this level during the second week. Trading volumes still support the uptrend. Copper prices could continue their rally.
Need buying strategies for copper in 2018? MetalMiner’s Annual Outlook has what you need
[caption id="attachment_90192" align="aligncenter" width="585"] Source: MetalMiner analysis of FastMarkets[/caption]
Labor Disputes Could Threaten Copper Supply
Mine strikes continually threaten copper supply. BHP’s Escondida mine, the world’s largest copper mine, failed to develop a new labor agreement in advance of formal negotiations, scheduled for June. Last year, a 43-day strike at the Escondida mine impacted copper supply.
Since BHP’s Escondida copper mine produces around 5% of the world’s copper, it’s easy to see the impact of strikes on LME copper prices.
Meanwhile, Glencore forecasts its own copper output to increase by 150,000 tons at its Katanga mine in the Democratic Republic of Congo.
U.S. Dollar, Copper Back to Negative Correlation
Copper and the U.S. dollar maintain a strong negative correlation. The negative correlation gives the direction of the trends; when the U.S. dollar is weaker (downtrend), copper prices are stronger (uptrend).
The negative correlation did not hold during the first six months of 2017, nor did it hold for commodities and the U.S. dollar. However, the historical negative correlation has reappeared, as copper prices and the U.S. dollar now trade in opposition to one another.
[caption id="attachment_90193" align="aligncenter" width="585"] The U.S. dollar in black. Copper spot prices in purple. Source: MetalMiner analysis of StockCharts[/caption]
The U.S. dollar traded sideways during Q3 2017. Many analysts (not MetalMiner) started to believe the U.S. dollar had reached a bottom.
MetalMiner, however, remained more bearish on the U.S. dollar, as the dollar did not give any clear signs of a trend reversal. The distinction between a short-term trend that could impact prices in one to three months, versus a long-term trend, which could actually impact a buying strategy becomes important. The fact remains, the U.S. dollar has fallen to a more than three-year low.
Copper Scrap vs. LME Copper
In January, copper scrap prices did not move with the LME copper price. LME copper prices fell slightly, while copper scrap prices increased by 2%. Therefore, the spread between the two decreased slightly this month. We can expect these types of divergences in the short term, although the two tend to trade together over the longer term.
[caption id="attachment_90194" align="aligncenter" width="585"] Source: MetalMiner data from MetalMiner IndX(™)[/caption]
In January, several Chinese copper scrap restrictions went into effect. The Ministry of Environmental Protection announced that only end-users and copper scrap processors will be allowed to import. This restriction in effect removes Chinese traders from the copper scrap market.
What This Means for Industrial Buyers
In January, buying organizations had some opportunities to buy some volume. The weak U.S. dollar and strength of other base metals support the bull narrative for copper. As long as copper prices remain bullish, buying organizations may want to “buy on the dips.” For those who want to understand how to reduce risks, take a free trial now to the MetalMiner Monthly Outlook.
Want to see an Copper Price forecast? Take a free trial!
Actual Copper Prices and Trends
Aluminum MMI: Aluminum Demand Gets Boost from Automotive, Aerospace Sectors
After last month’s sharp increase, the February Aluminum MMI (Monthly Metals Index) inched up one point.
The basket of metals increased despite the slight retracement of LME aluminum prices.The current Aluminum MMI index reads 99 points, 1.0% higher than in January.
In January, MetalMiner anticipated a possible retracement in aluminum prices, as aluminum — and, generally, all base metals — increased sharply at the end of the month. LME aluminum prices fell by 2.8% in January from the previous 2-year high closing price in December.
Buying Aluminum in 2018? Download MetalMiner’s free annual price outlook
[caption id="attachment_90155" align="aligncenter" width="580"] Source: MetalMiner analysis of FastMarkets[/caption]
Aluminum prices inched lower during the first few days of February. Aluminum prices broke out of their previous sideways trend back in August, providing a strong buying signal. As prices may continue to increase, buying organizations may want to understand how to better purchase aluminum, reducing both risks and costs.
U.S. Domestic Aluminum Market
The U.S. Department of Commerce sent the Section 232 report for aluminum products to President Trump in January. President Trump has 90 days (from January 22) to review and announce actions regarding the probe for aluminum products.
Meanwhile, domestic aluminum demand received a boost from stronger U.S. automotive and aerospace sectors.
Despite the fall in U.S. auto sales in January, aluminum producers see increased demand. Demand has increased so significantly that Novelis Inc., the biggest flat-rolled products maker, announced the investment of a new plant in Kentucky to support growing automotive demand.
[caption id="attachment_90156" align="aligncenter" width="580"] U.S. Total Vehicle Sales. Source: TradingEconomics[/caption]
Chinese Aluminum Market
SHFE aluminum prices currently trade lower than LME prices. Although the trends appear to be similar, SHFE aluminum prices fell further in January. Lower SHFE prices relative to LME aluminum prices lead to increased Chinese exports to Asia.
[caption id="attachment_90157" align="aligncenter" width="580"] Source: MetalMiner analysis of FastMarkets[/caption]
According to the latest Chinese customs data, Chinese exports of unwrought aluminum and aluminum products increased by 12.8% in December compared to December 2016 data. December exports also increased on a monthly basis by 15.8% over November’s figures.
Aluminum Premiums
U.S. Midwest aluminum premiums moved again at the beginning of February, and currently trade at $0.12/pound. The Section 232 investigation and uncertainty around the outcome has increased the volatility in the U.S. Midwest premium.
Other aluminum delivery premiums also increased this month. The CIF Japanese spot premium increased 12% over January, to $98.50-$110/mt from the previous $90-96/mt. The European duty-unpaid premium jumped by 8.1%, while the Brazil CIF duty-unpaid premium increased by 3%.
What This Means for Industrial Buyers
As expected after last month’s sharp increase, aluminum prices retraced in January. In bullish markets, buying organizations still have many opportunities to forward buy. Therefore, adapting the “right” buying strategy becomes crucial to reduce risks.
Want to see an Aluminum Price forecast? Take a free trial!
Actual Aluminum Prices and Trends
CRB-Dollar Correlation Returns as Base Metals Trade Higher
In January, some base metal prices increased sharply. This month, bullish sentiment in the industrial metals complex has extended to all base metals, as well as steel. Need buying strategies for steel? Try two free months of MetalMiner’s Outlook Commodities remain bullish, while the U.S. dollar continues to look more bearish. Back in Trends Commodities […]
Base Metals Trend Sideways This Month After End-of-2017 Surge
The base metal trendline appears to have shifted sideways this month after skyrocketing at the end of 2017. Market observers can take comfort knowing that after a meteoric rise, it takes time for the price to “digest” previous gains. Base metals prices remain in a more than two-year uptrend, and both base metals and steel […]