Last week, the U.S. International Trade Commission (ITC) voted to continue the AD and CVD investigations into common alloy aluminum sheet from China — a decision met with favor by some and concern by others within domestic industry. Buying Aluminum in 2018? Download MetalMiner’s free annual price outlook Unlike most such cases, the Department of Commerce […]
Tag: L1
Fitch Offers Warning of Faster than Expected Rate Rises
Some would argue the credit rating agencies do not have the best record in making predictions on the future direction of financial markets. Need buying strategies for steel in 2018? MetalMiner’s Annual Outlook has what you need However, they do have considerable resources at their disposal, so when they issue particularly dire warnings, common sense […]
America is Picking the Right Fight with the Wrong Enemy
The above headline is true, assuming the U.S.’s avowed aim is the health and future of the American steel industry and its workers. Need buying strategies for steel in 2018? MetalMiner’s Annual Outlook has what you need No one would dispute the idea that the world has too much steelmaking capacity. Many emerging markets and […]
The January MMI Report: Prices Rise as Industry Awaits Trump’s 232 Decision
It’s that time — our latest Monthly Metals Index (MMI) report is in, covering the final month of 2017. Need buying strategies for steel? Try two free months of MetalMiner’s Outlook So, before we move onto 2018 for good, let’s take one last look at our newest MMI report and recap some of the highlights: […]
Rio’s Massive Dunkerque Aluminum Smelter to Change Hands
Sanjeev Gupta, the industrial buyer of distressed steel, aluminum and coal assets (to name just a few of the areas he has expanded into in recent years), has so far managed an uncanny knack of good timing. Need buying strategies for steel in 2018? MetalMiner’s Annual Outlook has what you need Buying steel assets just […]
Section 232 Steel Probe Report Moves on to President Trump
After a couple of self-imposed deadlines blown by and a lot of waiting, the next step in the Section 232 process has finally arrived. Need buying strategies for steel? Try two free months of MetalMiner’s Outlook Thursday evening the Department of Commerce announced Secretary of Commerce Wilbur Ross had completed his Setion 232 steel report […]
Global Precious MMI: Sub-Index Continues Rise as Palladium Outpaces Platinum Again

Here’s What Happened
- Our Global Precious Monthly Metals Index (MMI), tracking a basket of precious metals from across the globe, rose yet another three points to 90 for the January reading, a 3.4% increase.
- We’re officially in a three-month rising trend for our precious metal sub-index. The last time we saw this buildup was back in Q3 2017, after which the index retreated. If that pattern holds, we could see a drop-off, perhaps as early as February — although seasonality and the global political and economic atmosphere in Q4 both likely had a lot to do with the outcome, which may not be replicated here in Q1 2018.
- Palladium officially busted through the $1,000 per ounce ceiling in December, and there were no signs of a turnaround for the January reading — the PGM per-ounce held above that level for the second straight month. (More on palladium below.)
- Meanwhile, it appears as though platinum will need to take advantage of a “Dry January.” The metal came out of the holidays very sluggish, recording only a $2 per ounce increase and beginning the new year in a rather flat state of malaise.
- “We’ve (still) got a trend, folks!” — this is the fourth straight month in which palladium is priced at a premium to platinum, which has not been the historical norm.
- And then there’s gold. After breaking and holding above the $1,300 per ounce threshold at the beginning of September for the first time since October 2016, the U.S. gold price is back above that benchmark after a few months off.
Benchmark Your Current Metal Price by Grade, Shape and Alloy: See How it Stacks Up
What’s Going On in the Background?
- Can palladium keep rising? That all depends. On the one hand, the supply market is pretty tight, and it has been for a while. In fact, the palladium market has been in deficit for the last six of seven years in which data is available, according to a good Reuters piece published just after the new year. On the other hand, the primary thing driving palladium demand, and therefore prices, is mainly Chinese automotive demand. Caveat: if that slows down or even goes in reverse (car puns are just the best, aren’t they?), palladium could go with it. As we reported earlier this week, a Wall Street Journal story pointed out Chinese consumers are now starting to get into used car sales even more, which could portend the end of unmitigated new car sales growth — much like China’s GDP cooldown over the last few years. To wit, here’s a sweet graphic showing the relationship between palladium and China’s automotive sales:
 Source: Thomson Reuters[/caption]
- Germans buying up some gold. Regarding that $1,300/ounce threshold we mentioned earlier that gold prices have been hovering above for a couple months straight? That has helped spot gold prices gain about 14% during 2017. Now, at least one nation — going by its recent investment activity — is hoping that upward trend continues. According to another Reuters article, Deutsche Boerse said its Xetra-Gold notes rose in demand to a record 175 tons of gold, a nearly 50% increase over 2016. Safe haven, here we come! (Ja?)
What Metal Buyers Should Look Out For
- PGMs. While ETF Securities, an investment and intelligence firm, which we used to cover quite regularly, expects precious metals (including PGMs) to remain pretty stable for the course of 2018 in its Outlook 2018 report, as we noted last month, keep a close eye on All Things China. This is especially important as it pertains to automotive partnerships between U.S. OEMs and China and the resulting innovation, as my colleague Fouad Egbaria reported earlier this week in our Automotive Monthly Metals Index (MMI).
- ICYMI, our own Irene Martinez Canorea drilled down into the gold markets before the end of 2017 from an analytical perspective, ultimately unlocking the reason why industrial metal buyers (especially those buying copper) should pay attention to gold.
Free Sample Report: Our Annual Metal Buying Outlook
Key Price Movers and Shakers
Raw Steels MMI: Steel Picks Up Speed as Industry Awaits Section 232 Outcome
The Raw Steels MMI (Monthly Metals Index) jumped another 1.3% this month, reaching 83 points in January.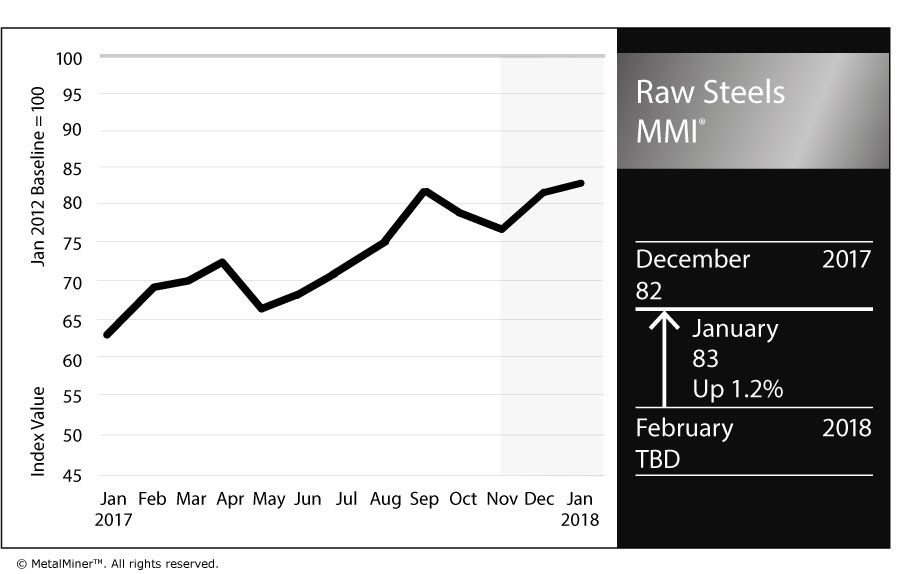
Steel momentum seems to have recovered this month. All forms of steel prices in the U.S. increased sharply. Steel momentum typically begins during the middle of Q4, but the increase occurred later this past year. January’s numbers also look bullish.
Benchmark Your Current Metal Price by Grade, Shape and Alloy: See How it Stacks Up
[caption id="attachment_89677" align="aligncenter" width="580"] U.S. HRC and CRC prices. Source: MetalMiner data from MetalMiner IndX(™)[/caption]
In the U.S. market, January will prove to be a decisive month.
The U.S. Secretary of Commerce Wilbur Ross has until mid-January to conclude his Section 232 probes and release a report to the Trump administration, after which the president has 90 days to act.
Shredded Scrap
The long-term shredded scrap price uptrend appears to have turned into a short-term sideways trend. Despite steel price increases in December, January scrap prices decreased.
[caption id="attachment_89678" align="aligncenter" width="580"]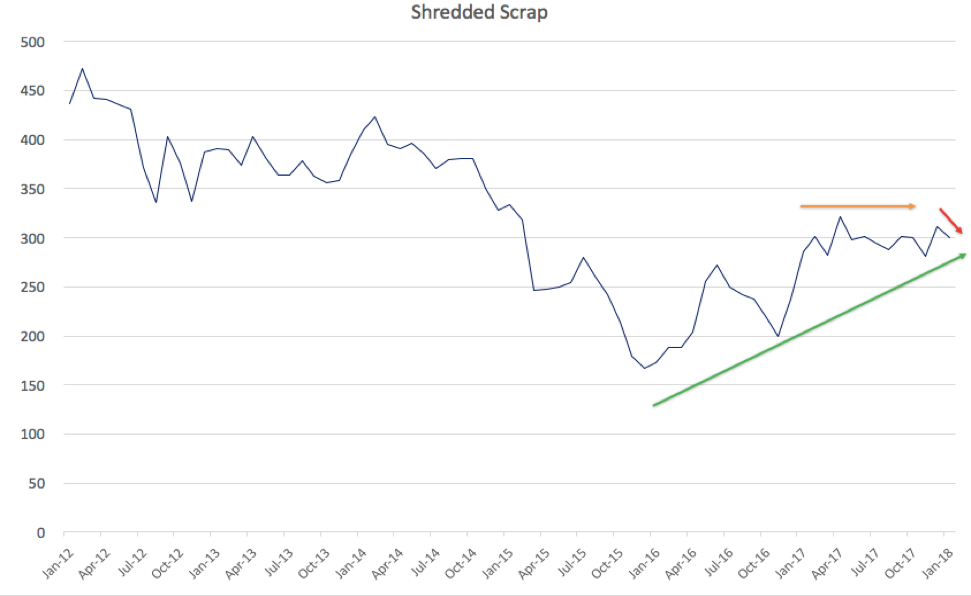 Source: MetalMiner data from MetalMiner IndX(™)[/caption]
Decreasing domestic scrap prices do not currently support steel prices. However, steel prices appear to be on a sustainable upward trend. Therefore, scrap prices could follow steel prices this month and continue their long-term uptrend.
Chinese Prices Still Strong
Chinese steel prices and U.S. prices usually tend to move similarly. Thus, when one reveals a strong upward or downward movement, the other could follow within that month.
Chinese prices were stronger than U.S. steel prices during November and December 2017. After the latest increase in U.S. steel prices, Chinese prices also continued rising.
[caption id="attachment_89679" align="aligncenter" width="580"] Source: MetalMiner data from MetalMiner IndX(™)[/caption]
Chinese steel prices have found support from the curtailment campaign in the country. Therefore, steel prices could continue increasing. Chinese Q4 GDP data, expected to show strength, also support Chinese steel prices. Chinese GDP data has come in over annual growth targets for the country.
What This Means for Industrial Buyers
As steel price dynamics showed a strong upward momentum this month, buying organizations may want to understand price movements to decide when to buy some volume. Buying organizations will want to pay close attention to Chinese price trends, lead times and whether domestic mill price hikes stick.
Buying organizations who have concerns about the Section 232 outcome and its impact on the steel industry may want to take a free trial now to our Monthly Metal Buying Outlook. Our February Monthly Outlook will include a detailed analysis of the Section 232 outcome.
Free Sample Report: Our Annual Metal Buying Outlook
Actual Raw Steel Prices and Trends
Stainless Steel MMI: LME Nickel Price Approaches $13K/MT
The Stainless Steel MMI (Monthly Metals Index) jumped six points this month, with a reading of 71. This reading ran higher than November’s (70), which then dropped to 65 for December before bouncing back for our January reading.
Benchmark Your Current Metal Price by Grade, Shape and Alloy: See How it Stacks Up
Skyrocketing LME nickel prices drove the Stainless Steel MMI. However, 304 and 316 Allegheny Ludlum surcharges fell slightly this month.
LME Nickel Makes Big Jump
As reported previously by MetalMiner, nickel price volatility has increased over the past few months.
Nickel prices jumped from the $10,600/metric ton level in October to almost breaching MetalMiner’s current $13,000/mt ceiling.
[caption id="attachment_89668" align="aligncenter" width="580"] Source: MetalMiner analysis of FastMarkets[/caption]
Trading volume remains strong, aligned with the recent popularity of nickel in the base metals complex. Besides stainless steel, nickel’s popularity has increased due to usage in batteries and electric cars. Q4 brought more activity for metals that have a direct impact on electric cars.
Nickel macro-indicators may support this latest rally.
The nickel deficit will continue this year. The International Nickel Study Group (INSG) reported a wider nickel deficit again in 2017, now up to 9,700 tons. A nickel supply deficit may add support to the nickel bullish rally and could create additional upward movements this year.
Buying organizations may want to be aware of these movements to identify opportunities to buy on the dips.
Chinese Stainless Steel
As reported by the International Stainless Steel Forum (ISSF), global stainless steel production increased by 7.4% during the first nine months of 2017. China drove the gains, with an increase in production of 8.8%. Stainless steel prices decreased around 7% in East Asian ports.
[caption id="attachment_89669" align="aligncenter" width="580"] Source: MetalMiner data from MetalMiner IndX(™)[/caption]
Chinese stainless steel coil prices increased slightly this month. Chinese prices remain higher than they were in Q2. However, there has not yet been a clear uptrend that signals prices may increase soon.
Domestic Stainless Steel Market
Despite the recovery in momentum of the Stainless MMI, NAS domestic stainless steel surcharges traded sideways this month. Despite trading flat, stainless steel surcharges remain well above last year’s lows (under $0.4/pound).
[caption id="attachment_89670" align="aligncenter" width="580"] Source: MetalMiner data from MetalMiner IndX(™)[/caption]
What This Means for Industrial Buyers
Stainless steel momentum appears in recovery, similar to all the other forms of steel.
However, due to nickel’s high price volatility, buying organizations may want to follow the market closely for opportunities to buy on the dips.
To understand how to adapt buying strategies to your specific needs on a monthly basis, take a look at our Monthly Metal Buying Outlook or you can take a free trial now.
Free Sample Report: Our Annual Metal Buying Outlook
Actual Stainless Steel Prices and Trends
Copper MMI: Dr. Copper is Back on the Bulls
The Copper MMI (Monthly Metals Index) jumped five points to 88, driven by skyrocketing LME copper prices. LME copper prices increased by 6.4% in December.
Benchmark Your Current Metal Price by Grade, Shape and Alloy: See How it Stacks Up
LME copper prices are back again over the $7,000/metric ton level. Moreover, copper prices breached a previous peak, signaling strength in the rally. Trading volume also remains heavy, supporting the uptrend.
[caption id="attachment_89608" align="aligncenter" width="580"] Source: MetalMiner analysis of Fast Markets[/caption]
Despite skyrocketing in December, copper prices fell slightly during the first few days of January. However, that does not signal any weakness for the rally yet, as prices increased for the entire previous month. Therefore, copper prices may take a little breather this month to digest previous gains.
The U.S. Dollar
Copper and the U.S. dollar have a negative correlation. This means when the the U.S. dollar appears high, copper prices tend to trade lower.
Right now, we see just the opposite.
[caption id="attachment_89609" align="aligncenter" width="580"] The U.S. dollar. Source: MetalMiner analysis of Trading Economics[/caption]
Some analysts believed that the U.S. dollar had turned the corner and had started to recover. Despite the Fed rate hike in December, the U.S. dollar has continued to fall. The U.S. dollar has also seen heavy selling volume, which suggests more weakness.
Typically, the U.S. dollar trades lower when commodities and base metals trade higher. Copper (Dr. if you will) tells us much about commodities because the dollar has such a great influence on its price (direction).
Therefore, buying organizations will want to follow U.S. dollar price trends closely.
Copper Scrap vs. LME Copper
The price divergence between copper scrap and LME remains wider than historical spreads; though, this month, both moved in tandem.
Chinese copper scrap prices increased by 5.76% this month, compared to the 6.4% jump in LME prices.
Although these two don’t increase by the same amount, they tend to follow a similar trend. Data from both reflects a clear uptrend that appears sustainable, at least for the short term.
[caption id="attachment_89610" align="aligncenter" width="580"] Source: MetalMiner data from MetalMiner IndX(™)[/caption]
What This Means for Industrial Buyers
During December, buying organizations had opportunities to buy some volume. The relevance of the price jumps increases when the U.S. dollar shows weaknesses and all the base metals show strength.
Therefore, as copper prices remain bullish, buying organizations may want to “buy on the dips.” For those who want to understand how to reduce risks, take a free trial now to MetalMiner Monthly Outlook.
Free Sample Report: Our Annual Metal Buying Outlook
Actual Copper Prices and Trends