Category: Premium

Rare Earths MMI: Global Market Projected to Hit $20 Billion by 2024

The Rare Earths Monthly Metals Index (MMI) held flat for the month, posting a value of 18 for our January reading. 
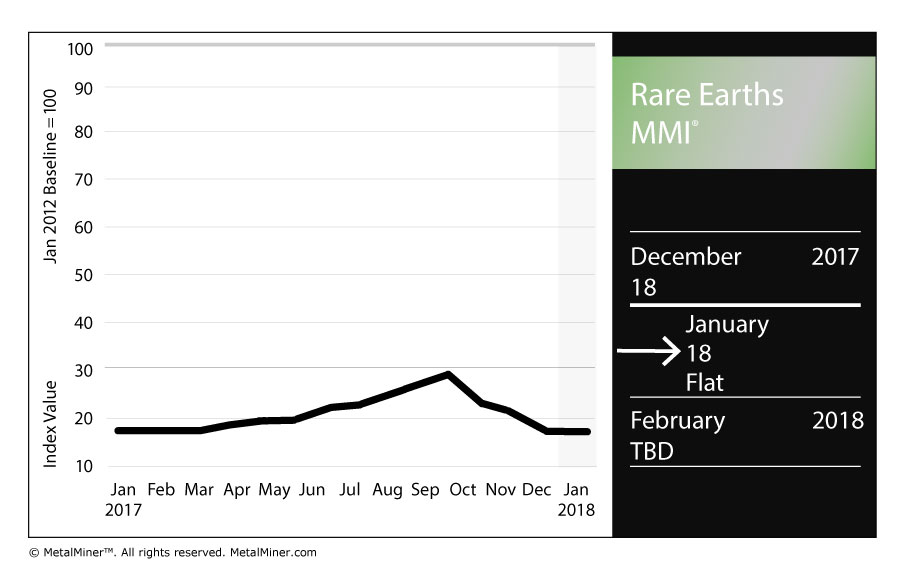
Reflecting the lack of movement in the MMI value, the basket of metals posted modest price fluctuations.
Two-Month Trial: Metal Buying Outlook
Chinese yttrium rose 1.9%, while terbium oxide dropped 0.8%. Neodymium oxide fell 1.3% on the month.

Australian Miner Receives State’s EPA Approval

A $900 million Australian miner received approval from the state’s Environmental Protection Authority (EPA), mining.com reported.
According to the report, Arafura Resources received approval on Friday after a two-year process. The EPA had been considering the environmental impacts of the Nolans rare earths project, the website reported, concluding that those risks at the site could be managed.
According to the report, Arafura estimates the project would create an investment of about $900 million in central Australia.

Global Market to Reach $20 Billion by 2024

The global rare earths market is projected to hit a value of $20 billion by 2024, according to a research report by Global Market Insights, Inc.
“Growing demand for magnets in automobiles, and energy generation will majorly contribute to the growth of global rare earth metals market over the forecast period,” the Globe Newswire release states. “The demand for rare earth magnets is majorly increasing by their consumption in electric and hybrid vehicles, and wind turbines. Increasing focus on utilizing clean and renewable energy is giving a substantial pressure on the electricity providers, to generate energy through renewable sources, which in turn will show a positive impact on the growth of this market.”
Not surprisingly given China’s overwhelming dominance of the rare earths markets, prices will continue to fluctuate somewhat wildly based on Chinese supply.
As for individual metals, neodymium will continue on in its place at or near the top of the rare-earths heap.
“By revenue, neodymium had the highest market share in 2016, with a market share of over 30%,” the release states. “It will dominate the global rare earth metals market till the end of projected period. Neodymium market will grow at a CAGR of 8.2% from 2017 to 2024.”
Free Sample Report: Our Annual Metal Buying Outlook

Actual Metal Prices and Trends

Global Precious MMI: Sub-Index Continues Rise as Palladium Outpaces Platinum Again

Global Precious MMI: Sub-Index Continues Rise as Palladium Outpaces Platinum Again

Here’s What Happened

  • Our Global Precious Monthly Metals Index (MMI), tracking a basket of precious metals from across the globe, rose yet another three points to 90 for the January reading, a 3.4% increase.
  • We’re officially in a three-month rising trend for our precious metal sub-index. The last time we saw this buildup was back in Q3 2017, after which the index retreated. If that pattern holds, we could see a drop-off, perhaps as early as February — although seasonality and the global political and economic atmosphere in Q4 both likely had a lot to do with the outcome, which may not be replicated here in Q1 2018.
  • Palladium officially busted through the $1,000 per ounce ceiling in December, and there were no signs of a turnaround for the January reading — the PGM per-ounce held above that level for the second straight month. (More on palladium below.)
  • Meanwhile, it appears as though platinum will need to take advantage of a “Dry January.” The metal came out of the holidays very sluggish, recording only a $2 per ounce increase and beginning the new year in a rather flat state of malaise.
  • “We’ve (still) got a trend, folks!” — this is the fourth straight month in which palladium is priced at a premium to platinum, which has not been the historical norm.
  • And then there’s gold. After breaking and holding above the $1,300 per ounce threshold at the beginning of September for the first time since October 2016, the U.S. gold price is back above that benchmark after a few months off.

Benchmark Your Current Metal Price by Grade, Shape and Alloy: See How it Stacks Up

What’s Going On in the Background?

  • Can palladium keep rising? That all depends. On the one hand, the supply market is pretty tight, and it has been for a while. In fact, the palladium market has been in deficit for the last six of seven years in which data is available, according to a good Reuters piece published just after the new year. On the other hand, the primary thing driving palladium demand, and therefore prices, is mainly Chinese automotive demand. Caveat: if that slows down or even goes in reverse (car puns are just the best, aren’t they?), palladium could go with it. As we reported earlier this week, a Wall Street Journal story pointed out Chinese consumers are now starting to get into used car sales even more, which could portend the end of unmitigated new car sales growth — much like China’s GDP cooldown over the last few years. To wit, here’s a sweet graphic showing the relationship between palladium and China’s automotive sales:
[caption id="attachment_89700" align="aligncenter" width="580"] Source: Thomson Reuters[/caption]
  • Germans buying up some gold. Regarding that $1,300/ounce threshold we mentioned earlier that gold prices have been hovering above for a couple months straight? That has helped spot gold prices gain about 14% during 2017. Now, at least one nation — going by its recent investment activity — is hoping that upward trend continues. According to another Reuters article, Deutsche Boerse said its Xetra-Gold notes rose in demand to a record 175 tons of gold, a nearly 50% increase over 2016. Safe haven, here we come! (Ja?)

What Metal Buyers Should Look Out For

  • PGMs. While ETF Securities, an investment and intelligence firm, which we used to cover quite regularly, expects precious metals (including PGMs) to remain pretty stable for the course of 2018 in its Outlook 2018 report, as we noted last month, keep a close eye on All Things China. This is especially important as it pertains to automotive partnerships between U.S. OEMs and China and the resulting innovation, as my colleague Fouad Egbaria reported earlier this week in our Automotive Monthly Metals Index (MMI).
  • ICYMI, our own Irene Martinez Canorea drilled down into the gold markets before the end of 2017 from an analytical perspective, ultimately unlocking the reason why industrial metal buyers (especially those buying copper) should pay attention to gold.

Free Sample Report: Our Annual Metal Buying Outlook

Key Price Movers and Shakers

GOES MMI: GOES M3 Prices Rise with Other Forms of Steel

Grain-oriented electrical steel (GOES) prices do not often follow the pattern of price increases for other forms of steel. However, December’s data suggests otherwise. GOES prices increased along with HRC, CRC, plate and HDG. In addition to prices moving in a similar direction, import levels also followed similar patterns, although GOES imports showed a dramatically […]

Raw Steels MMI: Steel Picks Up Speed as Industry Awaits Section 232 Outcome

Raw Steels MMI: Steel Picks Up Speed as Industry Awaits Section 232 Outcome

The Raw Steels MMI (Monthly Metals Index) jumped another 1.3% this month, reaching 83 points in January.
Steel momentum seems to have recovered this month. All forms of steel prices in the U.S. increased sharply. Steel momentum typically begins during the middle of Q4, but the increase occurred later this past year. January’s numbers also look bullish.
Benchmark Your Current Metal Price by Grade, Shape and Alloy: See How it Stacks Up
[caption id="attachment_89677" align="aligncenter" width="580"] U.S. HRC and CRC prices. Source: MetalMiner data from MetalMiner IndX(™)[/caption]
In the U.S. market, January will prove to be a decisive month.
The U.S. Secretary of Commerce Wilbur Ross has until mid-January to conclude his Section 232 probes and release a report to the Trump administration, after which the president has 90 days to act.
Shredded Scrap
The long-term shredded scrap price uptrend appears to have turned into a short-term sideways trend. Despite steel price increases in December, January scrap prices decreased.
[caption id="attachment_89678" align="aligncenter" width="580"] Source: MetalMiner data from MetalMiner IndX(™)[/caption]
Decreasing domestic scrap prices do not currently support steel prices. However, steel prices appear to be on a sustainable upward trend. Therefore, scrap prices could follow steel prices this month and continue their long-term uptrend.
Chinese Prices Still Strong
Chinese steel prices and U.S. prices usually tend to move similarly. Thus, when one reveals a strong upward or downward movement, the other could follow within that month.
Chinese prices were stronger than U.S. steel prices during November and December 2017. After the latest increase in U.S. steel prices, Chinese prices also continued rising.
[caption id="attachment_89679" align="aligncenter" width="580"] Source: MetalMiner data from MetalMiner IndX(™)[/caption]
Chinese steel prices have found support from the curtailment campaign in the country. Therefore, steel prices could continue increasing. Chinese Q4 GDP data, expected to show strength, also support Chinese steel prices. Chinese GDP data has come in over annual growth targets for the country.
What This Means for Industrial Buyers
As steel price dynamics showed a strong upward momentum this month, buying organizations may want to understand price movements to decide when to buy some volume. Buying organizations will want to pay close attention to Chinese price trends, lead times and whether domestic mill price hikes stick.
Buying organizations who have concerns about the Section 232 outcome and its impact on the steel industry may want to take a free trial now to our Monthly Metal Buying Outlook. Our February Monthly Outlook will include a detailed analysis of the Section 232 outcome.
Free Sample Report: Our Annual Metal Buying Outlook
Actual Raw Steel Prices and Trends

Stainless Steel MMI: LME Nickel Price Approaches $13K/MT

Stainless Steel MMI: LME Nickel Price Approaches $13K/MT

The Stainless Steel MMI (Monthly Metals Index) jumped six points this month, with a reading of 71. This reading ran higher than November’s (70), which then dropped to 65 for December before bouncing back for our January reading.
Benchmark Your Current Metal Price by Grade, Shape and Alloy: See How it Stacks Up
Skyrocketing LME nickel prices drove the Stainless Steel MMI. However, 304 and 316 Allegheny Ludlum surcharges fell slightly this month.
LME Nickel Makes Big Jump
As reported previously by MetalMiner, nickel price volatility has increased over the past few months.
Nickel prices jumped from the $10,600/metric ton level in October to almost breaching MetalMiner’s current $13,000/mt ceiling.
[caption id="attachment_89668" align="aligncenter" width="580"] Source: MetalMiner analysis of FastMarkets[/caption]
Trading volume remains strong, aligned with the recent popularity of nickel in the base metals complex. Besides stainless steel, nickel’s popularity has increased due to usage in batteries and electric cars. Q4 brought more activity for metals that have a direct impact on electric cars.
Nickel macro-indicators may support this latest rally.
The nickel deficit will continue this year. The International Nickel Study Group (INSG) reported a wider nickel deficit again in 2017, now up to 9,700 tons. A nickel supply deficit may add support to the nickel bullish rally and could create additional upward movements this year.
Buying organizations may want to be aware of these movements to identify opportunities to buy on the dips.
Chinese Stainless Steel
As reported by the International Stainless Steel Forum (ISSF), global stainless steel production increased by 7.4% during the first nine months of 2017. China drove the gains, with an increase in production of 8.8%. Stainless steel prices decreased around 7% in East Asian ports.
[caption id="attachment_89669" align="aligncenter" width="580"] Source: MetalMiner data from MetalMiner IndX(™)[/caption]
Chinese stainless steel coil prices increased slightly this month. Chinese prices remain higher than they were in Q2. However, there has not yet been a clear uptrend that signals prices may increase soon.
Domestic Stainless Steel Market
Despite the recovery in momentum of the Stainless MMI, NAS domestic stainless steel surcharges traded sideways this month. Despite trading flat, stainless steel surcharges remain well above last year’s lows (under $0.4/pound).
[caption id="attachment_89670" align="aligncenter" width="580"] Source: MetalMiner data from MetalMiner IndX(™)[/caption]
What This Means for Industrial Buyers
Stainless steel momentum appears in recovery, similar to all the other forms of steel.
However, due to nickel’s high price volatility, buying organizations may want to follow the market closely for opportunities to buy on the dips.
To understand how to adapt buying strategies to your specific needs on a monthly basis, take a look at our Monthly Metal Buying Outlook or you can take a free trial now. 
Free Sample Report: Our Annual Metal Buying Outlook
Actual Stainless Steel Prices and Trends

Aluminum MMI: Prices Rise and Trading Volumes Have Strong Showing

After last month’s drop, the Aluminum MMI (Monthly Metals Index) index increased by three points. The current Aluminum MMI index reads 98 points, 3.2% higher than the December reading. 
Benchmark Your Current Metal Price by Grade, Shape and Alloy: See How it Stacks Up
In December, MetalMiner anticipated a rise in aluminum prices … and that is exactly what happened.
Aluminum prices increased by 10.6% in December, reaching a more than two-year high.
[caption id="attachment_89629" align="aligncenter" width="580"] Source: MetalMiner analysis of FastMarkets[/caption]
Trading volumes appear strong and accompany the current uptrend. Moreover, aluminum’s latest peak has climbed over previous ones, signaling strength in its latest market rally. Other macroeconomic indicators, such as a weaker U.S. dollar and a stronger CRB index driven by higher oil prices, may continue to support aluminum prices.
Moreover, the Department of Commerce’s Section 232 investigation should see a report released mid-January, which will also impact prices. The U.S. Department of Commerce announced a new self-initiated anti-dumping and countervailing duty investigation on imports of Chinese common aluminum alloy sheet at the end of November. The U.S. has launched several anti-dumping campaigns for aluminum products this past year.
Crude Oil
As oil prices serve as a critical part of the CRB index, together with other base metals, buying organizations need to monitor oil price trends.
Moreover, there are some base metals, such as aluminum, that are strongly influenced by oil prices.
[caption id="attachment_89630" align="aligncenter" width="580"] Crude Oil prices. Source: MetalMiner analysis of Trading Economics[/caption]
Oil prices have increased again this month. Current oil prices remain above our bullish level signal, meaning that we could  expect some more upward movement for oil.
Similarly, increasing oil prices will continue to provide support to base metals prices.
Aluminum Scrap
Chinese aluminum scrap prices increased sharply this month and appear in a long-term uptrend since 2016.
The latest rally in both LME and SHFE aluminum prices also results in a jump in aluminum scrap prices. Chinese scrap prices increased by 4.9% this month.
[caption id="attachment_89631" align="aligncenter" width="580"] Source: MetalMiner data from MetalMiner IndX(™)[/caption]
What This Means for Industrial Buyers
Aluminum prices jumped sharply again this month. After sharp price increases, base metal prices sometimes pull back to digest the previous gains. Aluminum prices may lack some price momentum this month, although that continues signaling bullishness for the light metal.
Therefore, adapting the “right” buying strategy becomes crucial to reduce risks by knowing when to buy.
Free Sample Report: Our Annual Metal Buying Outlook
Actual Aluminum Prices and Trends

Copper MMI: Dr. Copper is Back on the Bulls

Copper MMI: Dr. Copper is Back on the Bulls

The Copper MMI (Monthly Metals Index) jumped five points to 88, driven by skyrocketing LME copper prices. LME copper prices increased by 6.4% in December.
Benchmark Your Current Metal Price by Grade, Shape and Alloy: See How it Stacks Up
LME copper prices are back again over the $7,000/metric ton level. Moreover, copper prices breached a previous peak, signaling strength in the rally. Trading volume also remains heavy, supporting the uptrend.
[caption id="attachment_89608" align="aligncenter" width="580"] Source: MetalMiner analysis of Fast Markets[/caption]
Despite skyrocketing in December, copper prices fell slightly during the first few days of January. However, that does not signal any weakness for the rally yet, as prices increased for the entire previous month. Therefore, copper prices may take a little breather this month to digest previous gains.
The U.S. Dollar
Copper and the U.S. dollar have a negative correlation. This means when the the U.S. dollar appears high, copper prices tend to trade lower.
Right now, we see just the opposite.
[caption id="attachment_89609" align="aligncenter" width="580"] The U.S. dollar. Source: MetalMiner analysis of Trading Economics[/caption]
Some analysts believed that the U.S. dollar had turned the corner and had started to recover. Despite the Fed rate hike in December, the U.S. dollar has continued to fall. The U.S. dollar has also seen heavy selling volume, which suggests more weakness.
Typically, the U.S. dollar trades lower when commodities and base metals trade higher. Copper (Dr. if you will) tells us much about commodities because the dollar has such a great influence on its price (direction).
Therefore, buying organizations will want to follow U.S. dollar price trends closely.
Copper Scrap vs. LME Copper
The price divergence between copper scrap and LME remains wider than historical spreads; though, this month, both moved in tandem.
Chinese copper scrap prices increased by 5.76% this month, compared to the 6.4% jump in LME prices.
Although these two don’t increase by the same amount, they tend to follow a similar trend. Data from both reflects a clear uptrend that appears sustainable, at least for the short term.
[caption id="attachment_89610" align="aligncenter" width="580"] Source: MetalMiner data from MetalMiner IndX(™)[/caption]
What This Means for Industrial Buyers
During December, buying organizations had opportunities to buy some volume. The relevance of the price jumps increases when the U.S. dollar shows weaknesses and all the base metals show strength.
Therefore, as copper prices remain bullish, buying organizations may want to “buy on the dips.”  For those who want to understand how to reduce risks, take a free trial now to MetalMiner Monthly Outlook.
Free Sample Report: Our Annual Metal Buying Outlook
Actual Copper Prices and Trends

Construction MMI: Architecture Billings Index Hits 2017 High

Construction MMI: Architecture Billings Index Hits 2017 High


The Construction Monthly Metals Index (MMI) lost a point for our January reading, falling to 94 from 95.
Two-Month Trial: Metal Buying Outlook
In terms of metals prices, it was a mixed bag for this group. The Chinese rebar price fell 4.8%, while Chinese H-beam steel rose 3.1%. U.S. shredded scrap steel also dropped 3.5%. European commercial 1050 aluminum sheet posted gains of 1.1%, while Chinese aluminum bar fell 6.3%.

U.S. Construction Spending

According to U.S. Census Bureau data for November (the most recently available month), total construction spending amounted to $1,257 billion, up 0.8% from the revised October estimate of $1,247.1 billion.

The November spending figure was 2.4% above the November 2016 estimate of $1,227.0 billion. In addition, through the first 11 months of 2017, construction spending amounted to $1,138.3 billion, or 4.2% above the $1,091.9 billion for the same period in 2016.

Private construction spending in November was at a seasonally adjusted annual rate of $964.3 billion, or 1.0% above the revised October estimate of $955.1 billion. Residential construction was at a seasonally adjusted annual rate of $530.8 billion in November, 1.0% above the revised October estimate of $525.3 billion. Nonresidential construction was at a seasonally adjusted annual rate of $433.5 billion in November, 0.9% above the revised October estimate of $429.7 billion.
Meanwhile, public construction spending, at $964.3 billion, was 1.3% above its October total.

Strong Growth for Architecture Firms

As tracked by the Architecture Billings Index (ABI), put out monthly by the American Institute of Architects, November proved to be a strong month for architecture billings.
Per the November ABI report, the billings ABI rose to 55 from last month’s 51.7 (a score of 50 indicates no growth).
“New project inquiries, as well as new design contracts coming into architecture firms, also signified healthy growth,” the report states. “As such, indicators broadly point to very solid business conditions at architecture firms as 2017 winds down.”
The uptick in design activity is in large part attributable to the strength of the economy, the monthly ABI report indicates: “GDP has grown at a 3 percent annualized rate through the second and third quarters this year. In the fourth quarter, our economy is likely to grow at about this same pace, and 2018 looks to see overall domestic economic gains in the 2.5 to 3.0 percent range. Strong consumer sentiment scores suggests that households are getting more comfortable with the direction of the economy as well as with their own financial situation.”
The report adds a strengthening labor market as another factor behind the rise in design activity. According to the report, there was a net gain of 228,000 payroll positions nationally in November, and annual 2017 numbers likely will hit at least a 2 million net gain for the sixth straight year. In terms of construction, specifically, there was a net gain of 24,000 construction positions in November, with 2017 gains “potentially as high as 200,000.”
By region, November was a strong month for the West, which led the four regions tracked in the ABI. The West region tallied a score of 54.8, ahead of the South and Northeast (each at 52.8) and the Midwest (50.4).
Free Sample Report: Our Annual Metal Buying Outlook

Actual Metal Prices and Trends

Automotive MMI: HDG Steel, LME Copper Post Big Price Increases

The Automotive MMI posted no movement for our January reading, sticking at 97 after a four-point jump from November to December.
Benchmark Your Current Metal Price by Grade, Shape and Alloy: See How it Stacks Up

The January MMI reading — which tracks the sector’s December performance — has risen significantly in the last 12 months. The sub-index posted an 82 for its January 2017 reading.
Within the basket of metals, U.S. HDG steel and LME copper had big months. For the former, the metal rose 5.5% during the period in question, while Dr. Copper jumped 6.4%.

U.S. Auto Sales

It was a down month for General Motors, which saw its sales drop 3.4% year-over-year in December 2017, with 308,112 units sold, according to sales data released Jan. 3 by Autodata Corp. GM thus closed the year with sales dropping 1.4% from its 2016 total.
Ford, meanwhile, saw its December sales rise 1.3% year-over-year, with 240,910 units sold in the month. As for the year-end numbers, Ford’s sales drop was less than GM’s, with a 0.9% dip compared to 2016 sales for the company.
Further down the sales list, Fiat Chrysler‘s December sales dropped 10.7% year-over-year and were down 8.2% for the year.
Fiat Chrysler wasn’t the only one to have a rough month. Toyota‘s December sales were down 8.3% year-over-year, while Honda‘s (7.0%) and Nissan‘s (9.5%) were also down.
Volkswagen dropped 5.4% in December compared with December 2016, but came out ahead in 2017, with sales rising 6.1% at year’s end compared with the previous year.
While Mitsubishi‘s absolute sales don’t come in near the top of the list, it had a good year in the U.S. market, selling 103,686 units in 2017 — up 7.7% from 2016 sales. In December, Mitsubishi’s sales rose 15.1% compared with December 2016.

Record Sales in 2017 for Tesla, But Struggles with Deliveries

Meanwhile, Tesla’s year was a two-sided tale.
As Business Insider UK reported, the electric vehicle (EV) maker hit record sales in 2017, but struggled with deliveries of its new Model 3.
The challenge for Tesla, of course, is transforming from a still relatively niche brand — catering to those who check the boxes of environmental mindfulness and being financially well off — to a mainstream automotive manufacturer capable of meeting demand with consistency.
It’s still unclear whether Tesla can do that, but EVs aren’t going away either way. Of course, Tesla isn’t the only player in the game, and competition in the EVs sector will only continue to grow in 2018 and beyond.

Eyes on China

A big year is ahead for automotive sales in China.
And it’s not just about this year — according to William C. Ford Jr., executive chairman of Ford, the future of EVs will be led by China.

“When I think of where E.V.s are going, it’s clearly the case that China will lead the world in E.V. development,” he told The New York Times.

Speaking of Ford, last month the automaker announced plans to collaborate with e-commerce conglomerate Alibaba. 

“Under the three-year agreement, both companies will jointly explore areas of cooperation that are re-shaping the automotive industry in China and around the world,” a Dec. 7 Ford news release states. “Ford will cooperate with Alibaba’s four business units in operation system, cloud computing, digital marketing and online retail respectively – namely AliOS, Alibaba Cloud, Alimama and Tmall – and jointly explore a variety of areas of cooperation including mobility services, connectivity, cloud computing, artificial intelligence and digital marketing.”
Ford President and CEO Jim Hackett also underscored the importance of China.
“China is one of the world’s largest and most dynamic digital markets, thriving on innovation with customers’ online and offline experiences converging rapidly,” he said in the release. “Collaborating with leading technology players builds on our vision for smart vehicles in a smart world to reimagine and revolutionize consumers’ mobility experiences.”
Free Sample Report: Our Annual Metal Buying Outlook

Actual Metal Prices and Trends

Sign up or sign in to grab exact prices!

Scroll to Top