New research has shown that India achieved an operational solar power capacity of 20 gigawatts (GW) by the end of 2017. Lower your aluminum spend – Take a free trial of MetalMiner’s Monthly Outlook! Mercom India Research has claimed a record 9.5 GW of solar power capacity was likely added in 2017, taking the total […]
Tag: L1
Stainless Steel MMI: LME Nickel Price, Stainless Surcharges Both Rise
The Stainless Steel MMI (Monthly Metals Index) jumped four points again this month for a February reading of 75.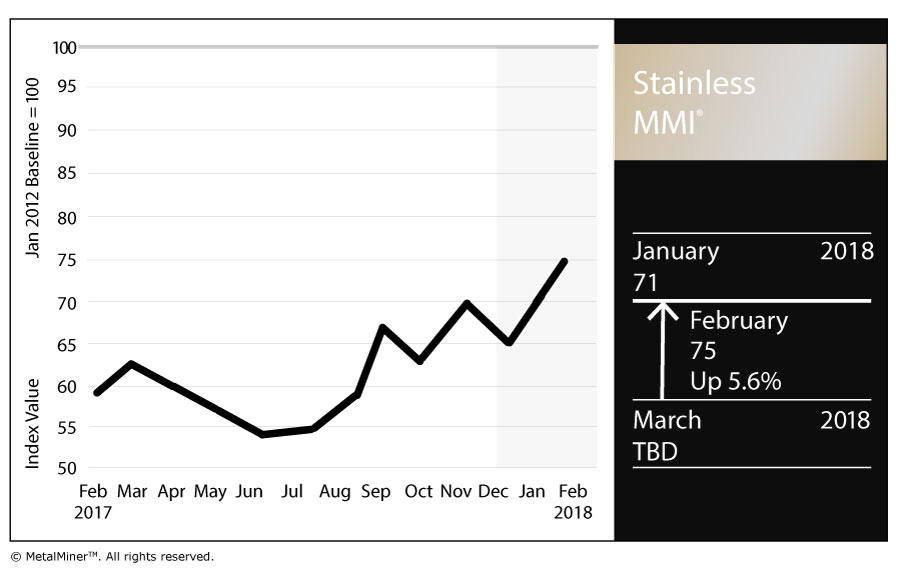
Need buying strategies for steel? Try two free months of MetalMiner’s Outlook
In January, skyrocketing LME nickel prices drove the Stainless Steel MMI. Nickel prices have climbed above the $13,000/mt level. 304 and 316 surcharges increased this month, returning to their previous levels.
LME Nickel
Nickel prices increased sharply during January. However, prices decreased slightly in early February. As reported previously by MetalMiner, nickel price volatility has increased over the past few months. Therefore, nickel prices may prove quite tumultuous from a short-term perspective and are trading within the orange-dotted band in the chart below.
[caption id="attachment_90272" align="aligncenter" width="580"] Source: MetalMiner analysis of FastMarkets[/caption]
The long-term nickel price uptrend also remains strong. Prices have moved toward June 2015 levels and already breached our October 2017 long-term resistance levels, as per our Annual Outlook. Therefore, nickel prices remain in a strong uptrend and could continue increasing in the coming months.
Domestic Stainless Steel Market
Following the recovery in stainless steel momentum, domestic stainless steel surcharges increased this month. Surcharges remain above last year’s lows (under $0.4/pound); they remain in an uptrend, even if their pace has slowed. However, buying organizations may want to look at surcharges closely to reduce risks, either via forward buys or hedging.
[caption id="attachment_90273" align="aligncenter" width="580"] Source: MetalMiner data from MetalMiner IndX(™)[/caption]
FerroChrome vs. Chrome Metal
Two months ago, MetalMiner reported on the anomaly between ferrochrome and chrome metal prices.
[caption id="attachment_90274" align="aligncenter" width="580"]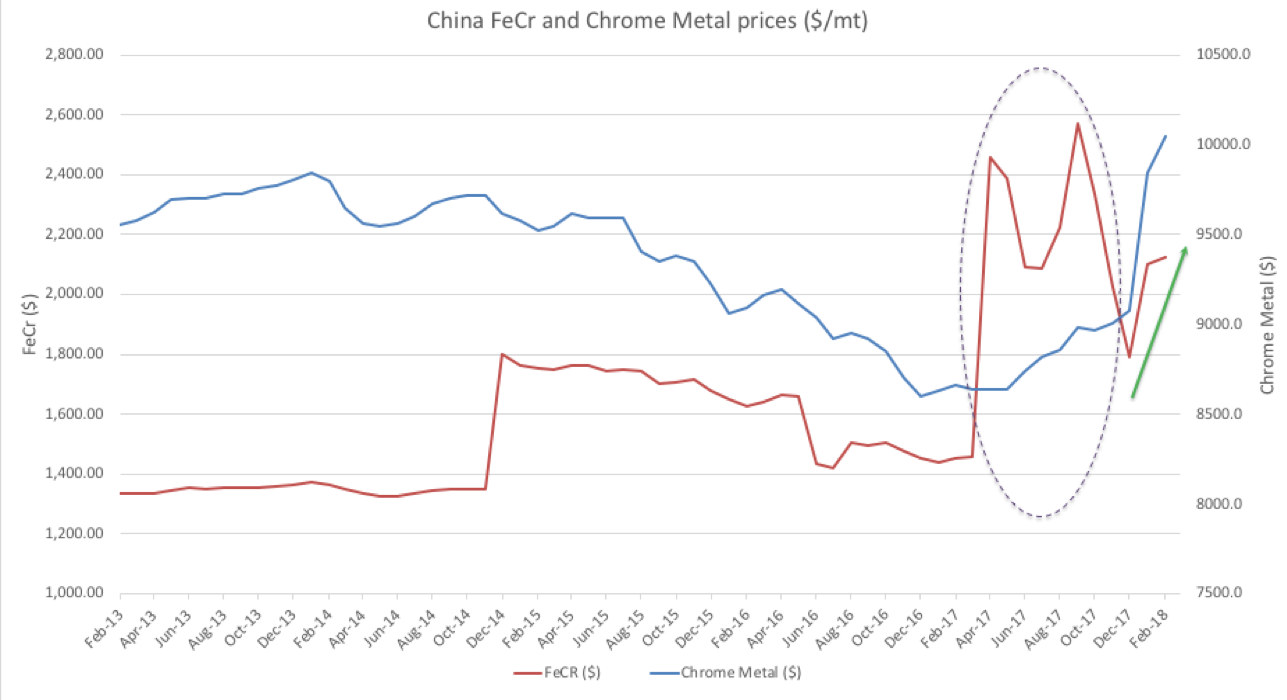 Source: MetalMiner data from MetalMiner IndX(™)[/caption]
Ferrochrome (FeCr) is a chromium and iron alloy containing 50% to 70% chromium by weight. Historically, Ferrochrome and chrome prices correlate tightly but the high iron ore prices caused ferrochrome to spike. However, both prices (ferrochrome and chrome) have fallen back to their historical trading pattern of moving together.
What This Means for Industrial Buyers
Stainless steel momentum appears in recovery, similar to all the other forms of steel. As both steel and nickel remain in a bull market, buying organizations may want to follow the market closely for opportunities to buy on the dips. To understand how to adapt buying strategies to your specific needs on a monthly basis, take a free trial of our Monthly Outlook now.
MetalMiner’s Annual Outlook provides 2018 buying strategies for carbon steel
Actual Stainless Steel Prices and Trends
SMDI Makes Case for Steel Over Aluminum During Chicago Auto Show
Use of aluminum in automotive bodies has gained steam in recent years — and the metal’s rivalry with steel has heated up in the process. Need buying strategies for steel? Try two free months of MetalMiner’s Outlook For example, Ford Motor Co. shook up the marketplace when it announced its all-aluminum body F-150 2015 model. […]
Copper MMI: Copper Prices Cool After December Surge
The Copper MMI (Monthly Metals Index) traded lower this month, falling one point for a February reading of 87. The fall was driven by a slight retracement of copper prices, which had skyrocketed in December. In January, LME copper prices fell by 1.21%.
Despite the price retracement, LME copper prices held above the $7,000/mt level at the beginning of February, and fell below this level during the second week. Trading volumes still support the uptrend. Copper prices could continue their rally.
Need buying strategies for copper in 2018? MetalMiner’s Annual Outlook has what you need
[caption id="attachment_90192" align="aligncenter" width="585"] Source: MetalMiner analysis of FastMarkets[/caption]
Labor Disputes Could Threaten Copper Supply
Mine strikes continually threaten copper supply. BHP’s Escondida mine, the world’s largest copper mine, failed to develop a new labor agreement in advance of formal negotiations, scheduled for June. Last year, a 43-day strike at the Escondida mine impacted copper supply.
Since BHP’s Escondida copper mine produces around 5% of the world’s copper, it’s easy to see the impact of strikes on LME copper prices.
Meanwhile, Glencore forecasts its own copper output to increase by 150,000 tons at its Katanga mine in the Democratic Republic of Congo.
U.S. Dollar, Copper Back to Negative Correlation
Copper and the U.S. dollar maintain a strong negative correlation. The negative correlation gives the direction of the trends; when the U.S. dollar is weaker (downtrend), copper prices are stronger (uptrend).
The negative correlation did not hold during the first six months of 2017, nor did it hold for commodities and the U.S. dollar. However, the historical negative correlation has reappeared, as copper prices and the U.S. dollar now trade in opposition to one another.
[caption id="attachment_90193" align="aligncenter" width="585"] The U.S. dollar in black. Copper spot prices in purple. Source: MetalMiner analysis of StockCharts[/caption]
The U.S. dollar traded sideways during Q3 2017. Many analysts (not MetalMiner) started to believe the U.S. dollar had reached a bottom.
MetalMiner, however, remained more bearish on the U.S. dollar, as the dollar did not give any clear signs of a trend reversal. The distinction between a short-term trend that could impact prices in one to three months, versus a long-term trend, which could actually impact a buying strategy becomes important. The fact remains, the U.S. dollar has fallen to a more than three-year low.
Copper Scrap vs. LME Copper
In January, copper scrap prices did not move with the LME copper price. LME copper prices fell slightly, while copper scrap prices increased by 2%. Therefore, the spread between the two decreased slightly this month. We can expect these types of divergences in the short term, although the two tend to trade together over the longer term.
[caption id="attachment_90194" align="aligncenter" width="585"] Source: MetalMiner data from MetalMiner IndX(™)[/caption]
In January, several Chinese copper scrap restrictions went into effect. The Ministry of Environmental Protection announced that only end-users and copper scrap processors will be allowed to import. This restriction in effect removes Chinese traders from the copper scrap market.
What This Means for Industrial Buyers
In January, buying organizations had some opportunities to buy some volume. The weak U.S. dollar and strength of other base metals support the bull narrative for copper. As long as copper prices remain bullish, buying organizations may want to “buy on the dips.” For those who want to understand how to reduce risks, take a free trial now to the MetalMiner Monthly Outlook.
Want to see an Copper Price forecast? Take a free trial!
Actual Copper Prices and Trends
Aluminum MMI: Aluminum Demand Gets Boost from Automotive, Aerospace Sectors
After last month’s sharp increase, the February Aluminum MMI (Monthly Metals Index) inched up one point.
The basket of metals increased despite the slight retracement of LME aluminum prices.The current Aluminum MMI index reads 99 points, 1.0% higher than in January.
In January, MetalMiner anticipated a possible retracement in aluminum prices, as aluminum — and, generally, all base metals — increased sharply at the end of the month. LME aluminum prices fell by 2.8% in January from the previous 2-year high closing price in December.
Buying Aluminum in 2018? Download MetalMiner’s free annual price outlook
[caption id="attachment_90155" align="aligncenter" width="580"] Source: MetalMiner analysis of FastMarkets[/caption]
Aluminum prices inched lower during the first few days of February. Aluminum prices broke out of their previous sideways trend back in August, providing a strong buying signal. As prices may continue to increase, buying organizations may want to understand how to better purchase aluminum, reducing both risks and costs.
U.S. Domestic Aluminum Market
The U.S. Department of Commerce sent the Section 232 report for aluminum products to President Trump in January. President Trump has 90 days (from January 22) to review and announce actions regarding the probe for aluminum products.
Meanwhile, domestic aluminum demand received a boost from stronger U.S. automotive and aerospace sectors.
Despite the fall in U.S. auto sales in January, aluminum producers see increased demand. Demand has increased so significantly that Novelis Inc., the biggest flat-rolled products maker, announced the investment of a new plant in Kentucky to support growing automotive demand.
[caption id="attachment_90156" align="aligncenter" width="580"] U.S. Total Vehicle Sales. Source: TradingEconomics[/caption]
Chinese Aluminum Market
SHFE aluminum prices currently trade lower than LME prices. Although the trends appear to be similar, SHFE aluminum prices fell further in January. Lower SHFE prices relative to LME aluminum prices lead to increased Chinese exports to Asia.
[caption id="attachment_90157" align="aligncenter" width="580"] Source: MetalMiner analysis of FastMarkets[/caption]
According to the latest Chinese customs data, Chinese exports of unwrought aluminum and aluminum products increased by 12.8% in December compared to December 2016 data. December exports also increased on a monthly basis by 15.8% over November’s figures.
Aluminum Premiums
U.S. Midwest aluminum premiums moved again at the beginning of February, and currently trade at $0.12/pound. The Section 232 investigation and uncertainty around the outcome has increased the volatility in the U.S. Midwest premium.
Other aluminum delivery premiums also increased this month. The CIF Japanese spot premium increased 12% over January, to $98.50-$110/mt from the previous $90-96/mt. The European duty-unpaid premium jumped by 8.1%, while the Brazil CIF duty-unpaid premium increased by 3%.
What This Means for Industrial Buyers
As expected after last month’s sharp increase, aluminum prices retraced in January. In bullish markets, buying organizations still have many opportunities to forward buy. Therefore, adapting the “right” buying strategy becomes crucial to reduce risks.
Want to see an Aluminum Price forecast? Take a free trial!
Actual Aluminum Prices and Trends
Construction MMI: 2017 U.S. Construction Spending Rises 2.7%
The Construction MMI stood pat this past month, holding at 94 for our February reading.
Need buying strategies for steel? Try two free months of MetalMiner’s Outlook
 Within the basketball of metals, Chinese rebar dropped 6.6%, while Chinese H-beam steel rose 3.3%.
U.S. shredded scrap steel jumped 7.7%. European 1050 sheet aluminum dropped marginally (by 0.05%), while the Chinese aluminum bar price jumped 1.7%.
U.S. Construction Spending
According to the most recently available Census Bureau data, U.S. construction spending in December 2017 amounted to $1,253.3 billion, up 0.7% from the revised November estimate of $1,245.1 billion.
December 2017 spending was up 2.7% year over year, compared with the $1,221.6 billion spent in December 2016.
By value, the value of construction in 2017 was $1,230.6 billion, up 3.8% from $1,185.7 billion in 2016.
Private construction spending grew more than its public counterpart. Private construction spending jumped 0.8% from the previous month to $963.2 billion, Within that umbrella, residential and nonresidential spending jumped 0.5% and 1.1%, respectively.
The value of private construction in 2017 was $950.7 billion, up 5.8% from the $898.7 billion spent in 2016. Residential construction in 2017 was $515.9 billion, up 10.6% from the 2016 figure of $466.6 billion and nonresidential construction was $434.8 billion, up 0.6% from the $432.1 billion in 2016.
Meanwhile, public construction spending jumped 0.3% to $290 billion in December 2017 from the previous month. Educational construction spending jumped 1.6% from November, while highway construction picked up a 0.3% spending gain.
Meanwhile, public construction spending jumped 0.3% to $290 billion in December 2017 from the previous month. Educational construction spending jumped 1.6% from November, while highway construction picked up a 0.3% spending gain.
Home Sales Down in December but Up for the Year
According to the National Association of Realtors, existing-home sales dropped in December but were up 1.1% for 2017.
The 5.51 million sales executed in 2017 marked the highest total since 2006 (6.48 million).
“Existing sales concluded the year on a softer note, but they were guided higher these last 12 months by a multi-year streak of exceptional job growth, which ignited buyer demand,” said Lawrence Yun, the NAR’s chief economist, in a prepared statement. “At the same time, market conditions were far from perfect. New listings struggled to keep up with what was sold very quickly, and buying became less affordable in a large swath of the country. These two factors ultimately muted what should have been a stronger sales pace.”
New housing starts, however, were down significantly in December.
According to jointly released data from the Census Bureau and the U.S. Department of Housing and Urban Development, new home starts in December dropped 8.2% compared with November totals. The 1,192,000 housing starts in December also marked a drop compared with December 2016, falling by 6.0%.
The Future of Construction
According to an article in Forbes, three trends could have a significant impact on the construction industry: robotics, drone imagery and digital project collaboration tools.
“Construction will benefit from robotics in work that is dangerous, is repetitive, and where heavy lifting is required,” Zak Podkaminer, of Construction Robotics, told Forbes. “[In] high precision work such as complex designs and patterns, robotics will provide a significant time savings allowing for more digital fabrication and provide architects more creative flexibility.”
Drone imagery, meanwhile, will serve to produce more accurate site analysis, the article argues, while digital collaboration tools will help streamline a construction process that still uses a number of traditional forms of communication and data storage — fax machines, physical binders, etc. — and make the transfer of information more seamless.
Actual Metal Prices and Trends
Automotive MMI: General Motors Starts 2018 on Strong Sales Note
The Automotive MMI got off to a hot start in 2018, picking up three points en route to a February reading of 100. The February reading marked the first triple-digit performance for the MMI since it posted a 101 in January 2014. 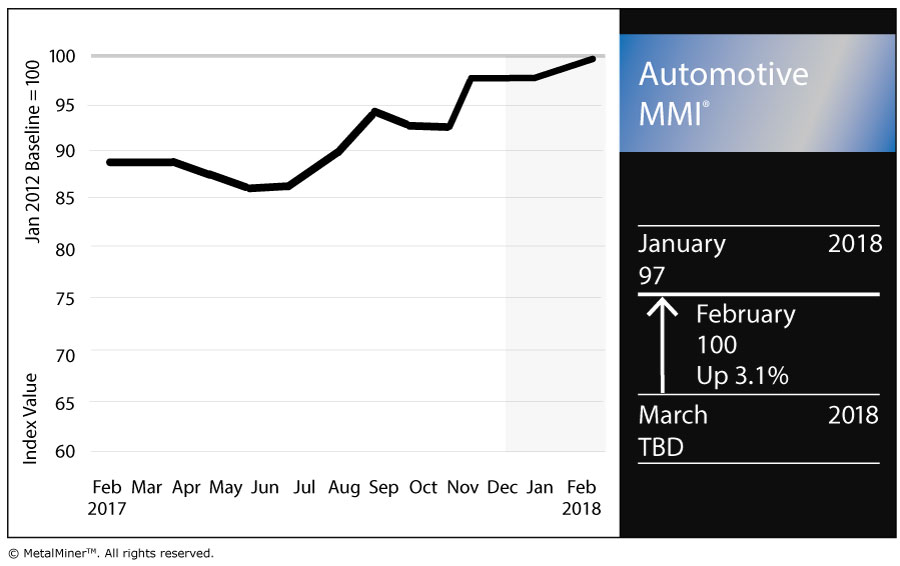
As for the basket of metals, a majority of the bunch posted price increases this past month.
Need buying strategies for steel in 2018? MetalMiner’s Annual Outlook has what you need
U.S. HDG steel jumped 2.7% as of Feb. 1, while U.S. platinum bars rose 6.2%. Fellow platinum-group metal (PGM) palladium fell for the month, however, by 5.8%.
U.S. shredded scrap jumped 7.7% and Korean aluminum 5052 coil rose 6.7%.
U.S. Auto Sales
January proved to a be a mixed bag for automakers vis-a-vis their U.S. sales.
According to data from Autodata Corp released Feb. 1, topping the charts in January was General Motors Corp., with 198,386 units sold, up 13% year over year. Sales of light trucks carried the day, as they increased 12.6% to soften a 30.2% drop in car sales. (General Motors is expected to announce its fourth-quarter 2017 and full-year earnings Tuesday, Feb. 6.)
In mid-January, GM forecasted 2018 would be another good year. According to a GM release, the company benefited from “continued strength” in North America and China, plus improvement in South America.
“GM had a very good 2017 as we continued to transform our company to be more focused, resilient and profitable,” GM Chairman and CEO Mary Barra said in the release. “We are positioned for another strong year in 2018 and an even better one in 2019.”
GM touted its growth in truck sales in a release last Thursday.
“All of our brands are building momentum in the industry’s hottest and most profitable segments,” said Kurt McNeil, U.S. vice president, sales operations, in the prepared statement. “Chevrolet led the growth of the small crossover segment with the Trax as well as the mid-pickup segment with the Colorado. Now, we have the all-new Equinox and Traverse delivering higher sales, share and transaction prices.”
Meanwhile, Ford Motor Company, which called 2017 a “challenging” year during its earnings call last week, didn’t have quite as good of a month. Ford posted a 6.3% year-over-year sales drop, with 160,411 units sold in January.
Down the list, Fiat Chrysler had a rough month, posting a 12.8% year-over-year decline. Toyota sales jumped 16.8%, Honda‘s were down 1.7% and Nissan‘s jumped 10.0%.
Volkswagen, meanwhile, found itself adding to the bad press from its Dieselgate scandal when it was reported last month that the company conducted exhaust tests on monkeys. Volkswagen’s January U.S. sales were down a whopping 32.8% year over year.
China and EVs
Everybody knows about Tesla and Elon Musk — but what about China and its role in what will assuredly become an increasingly electrified automotive world?
According to Bloomberg, one small town in southeast China will house a planned $1.3 billion battery factory that could stymie the global competition.
“The company plans to raise 13.1 billion yuan ($2 billion) as soon as this year by selling a 10 percent stake, at a valuation of about $20 billion,” the Bloomberg report states. “The share sale would finance construction of a battery-cell plant second in size only to Tesla Inc.’s Gigafactory in Nevada—big enough to cement China as the leader in the technology replacing gas-guzzling engines.”
MetalMiner’s Annual Outlook provides 2018 buying strategies for carbon steel
Actual Metal Prices and Trends
U.K. Automotive to Get a Boost to its Supply Chain
We have written before about the GFG Alliance and, in particular, within that Executive Chairman Sanjeev Gupta’s Liberty Group that has bought distressed steel and aluminum assets in the U.K. over the last 10 years. Last month, Gupta’s Liberty Group announced plans to add Europe’s largest aluminum smelter in Dunkerque, France, to its portfolio. MetalMiner’s […]
USGS: U.S. Mines Produced $75.2 Billion in Minerals Last Year
According to a recent report from the U.S. Geological Survey, the U.S. mining industry produced $75.2 billion in minerals in 2017. Buying Aluminum in 2018? Download MetalMiner’s free annual price outlook The information was published in the USGS’s annual Mineral Commodities Survey. In the import market, the U.S. was 100% reliant on outside sources for […]
Chinese Steel Prices Ease as Demand Softens in Winter Season
Normally when supply is constrained prices will rise, but China’s steel market is presently at the mercy of several dynamics. Need buying strategies for steel? Try two free months of MetalMiner’s Outlook On the one hand, Beijing is constraining polluting industries like steel and coke production. Those same policy decisions, however, are hitting industries that […]